tweetindex
DE

Aswath Damodaran ✓

@AswathDamodaran · New York & San Diego · joined 19 Apr 2009

Fascinated by finance & markets and like writing about them, but teaching is my passion.

512 206Followers
3Following
3 403Posts total
1MViews on collected posts

Neueste Beiträge

@AswathDamodaran I love your flow diagram graph with the conditional interpretation . No ai could do a better job than that 1.3K views · 5 likes · 0 reposts · 0 replies Open on X →
Global equities have seen market capitalization rise by $17 trillion, but Indian and Chinese equities have struggled (in US dollar terms) with the median company in each of these markets down for the year. https://t.co/SrfO3u4Mc5 https://t.co/IhCIBvoq6m
10.2K views · 19 likes · 0 reposts · 2 replies Open on X →
As the FOMC meetings approach next week, it is worth remembering that what happens to US treasury rates for the rest of the year and into next year, has little do with what Warsh and Bessent do (or don't do) and more to do with how inflation plays out. https://t.co/SrfO3u4Mc5 9.9K views · 45 likes · 1 reposts · 4 replies Open on X →
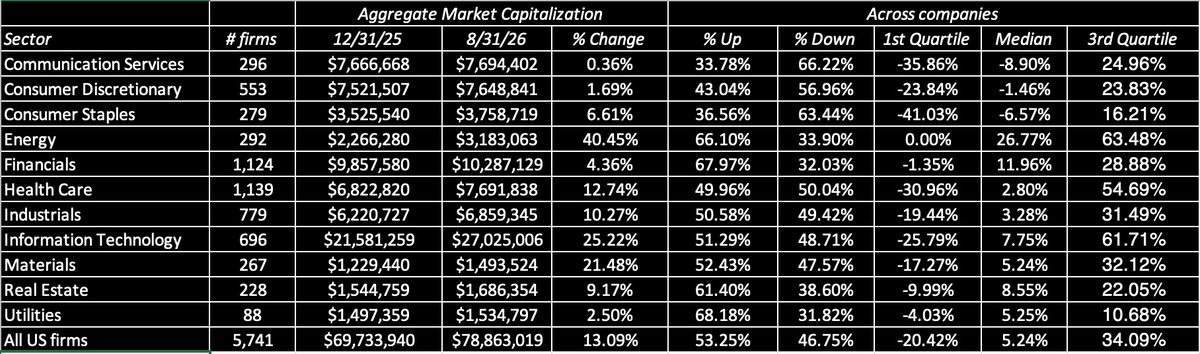
Breaking down US equities by sector, the biggest winner this year is energy (not surprisingly) followed by tech (though the winnings are skewed towards bigger firms). Consumer sectors and communications have lagged the market. https://t.co/SrfO3u4Mc5 https://t.co/didxgIgOa0
2.4K views · 16 likes · 0 reposts · 3 replies Open on X →
US equities, in the aggregate, have proven resilient, at least so far in 2026, with both the S&P 500 and the NASDAQ posting double-digit appreciation for the year (through the end of August), in the face of rising rates. https://t.co/SrfO3u4Mc5 https://t.co/NSCl49oxJK
2.6K views · 11 likes · 0 reposts · 1 replies Open on X →
The main source of this resilience has been the capacity of US companies to deliver higher earnings, even as interest rates rise, with estimated earnings for 2026 and 2027 for S&P 500 companies rising about 11%, during the course of 2026. https://t.co/SrfO3u4Mc5 https://t.co/e80
2.4K views · 22 likes · 0 reposts · 2 replies Open on X →
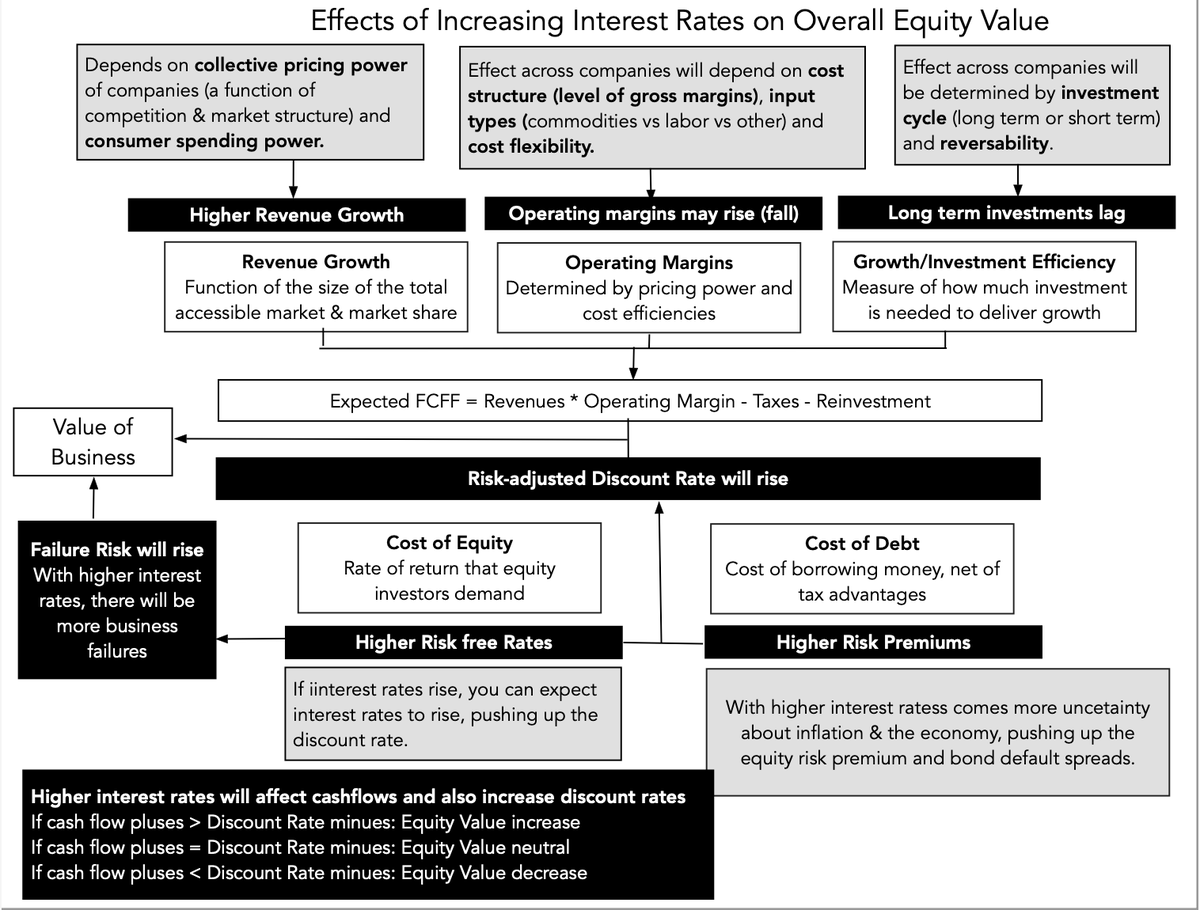
Companies with pricing power, high gross margins and shorter horizon reinvestment are better positioned to hold their own or gain, in the face of higher rates. https://t.co/SrfO3u4Mc5 https://t.co/jCm3Qrgwx9
2.8K views · 26 likes · 3 reposts · 1 replies Open on X →
The effect of rising interest rates on equities, in the aggregate, will depend on how those rising rates affect cash flows, as revenues, margins and reinvestment can all change, leaving a net effect that can be negative, neutral or positive. https://t.co/SrfO3u4Mc5 https://t.co/1
3.2K views · 29 likes · 3 reposts · 1 replies Open on X →
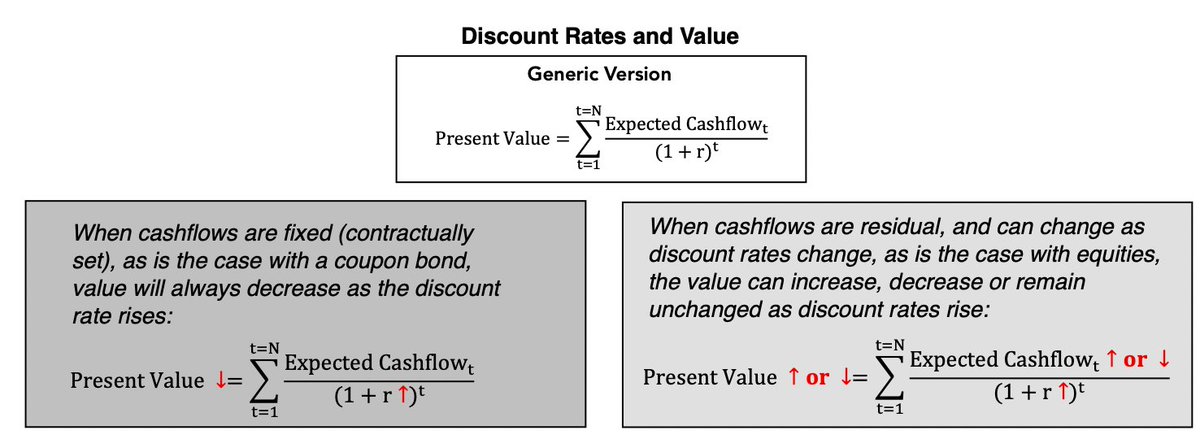
Rising interest rates will push up discount rates in a discounted cash flow valuation, and while that will always lower value, if cashflows are fixed (bond), the effects are muddied when cashflows change as rates change (as is true with equities). https://t.co/SrfO3u4Mc5 https://
3.1K views · 20 likes · 1 reposts · 1 replies Open on X →
Government bond rates in the Chinese Yuan, the Indian rupee, the Brazilian Real and the South African rand have diverged from developed market currencies, with only the Brazilian real seeing higher rates today than in 2021. https://t.co/SrfO3u4Mc5 https://t.co/LTKZ0SuVPI
3.5K views · 18 likes · 2 reposts · 1 replies Open on X →
As government bond rates converge, the carry trade, a brain-dead strategy of borrowing money in low-rate currencies and investing in higher-rate currencies, hoping that exchange rates stay put, has been decimated. No tears to shed! https://t.co/SrfO3u4Mc5 3.1K views · 20 likes · 0 reposts · 1 replies Open on X →
Government bond rates have risen not just in the US, but across developed market currencies, in the last five years and in 2026, with rates in 2026 triple or even quadruple what they were in 2021 in these currencies. https://t.co/SrfO3u4Mc5 https://t.co/mV8AG23Ant
3.5K views · 17 likes · 0 reposts · 1 replies Open on X →
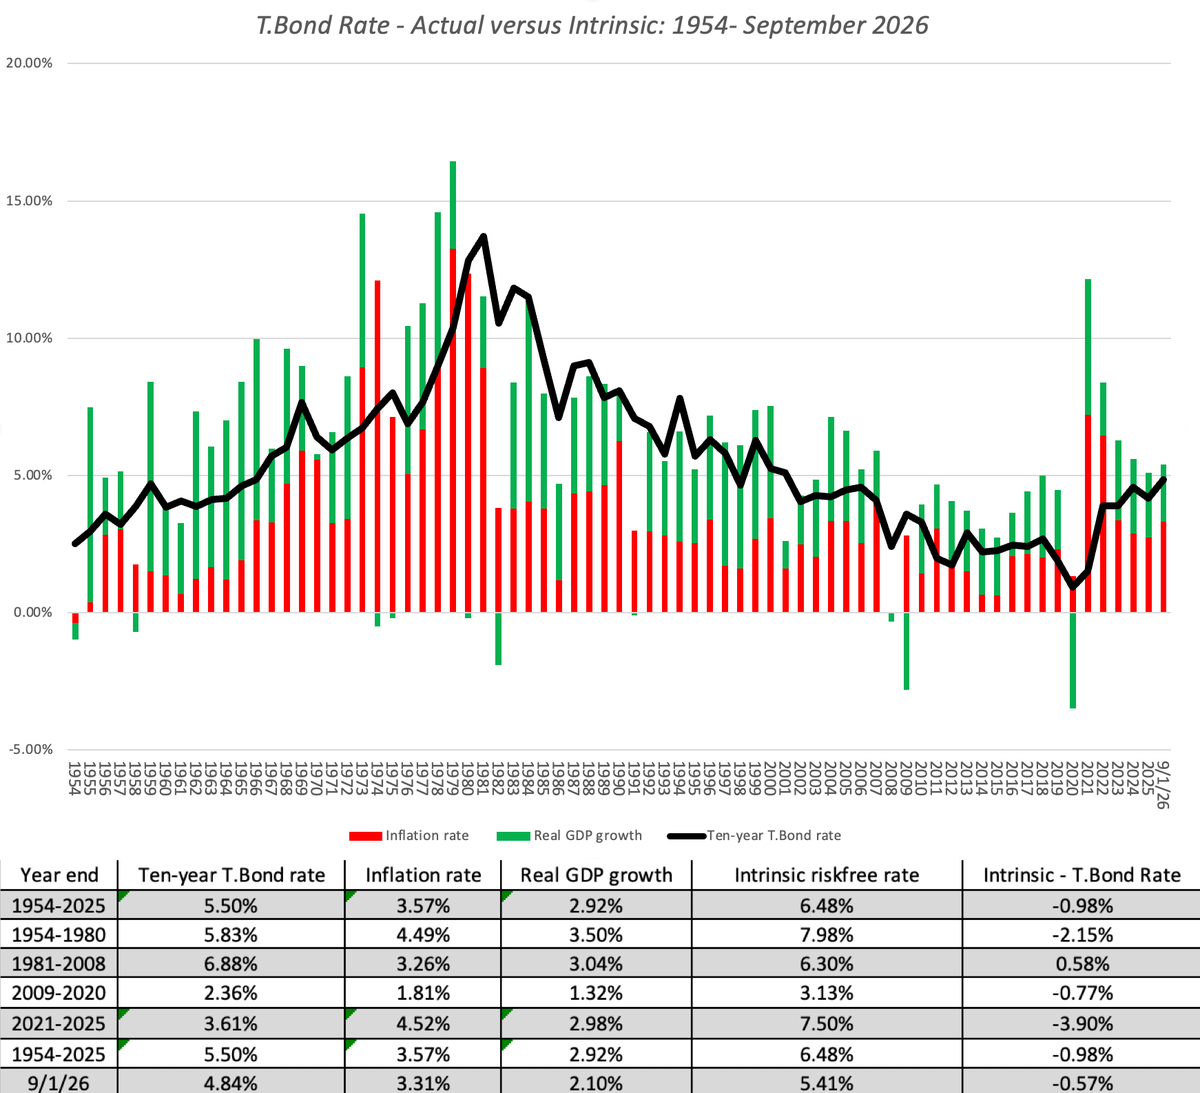
Adding the actual inflation rate to the real GDP growth rate yields an estimate of the "intrinsic riskfree rate", but these simplistic estimates do surprisingly well at explaining movements in observed 10-year treasury rates over time. https://t.co/SrfO3u4Mc5 https://t.co/25Opn3
4.1K views · 30 likes · 3 reposts · 1 replies Open on X →
Interest rate discussions can quickly become mired in arguments about central banks and government debt, but an interest rate, while set by market demand and supply, can be decomposed into expected inflation and an expected real rate. https://t.co/SrfO3u4Mc5 https://t.co/ZH3S2zBd
4.5K views · 25 likes · 2 reposts · 1 replies Open on X →
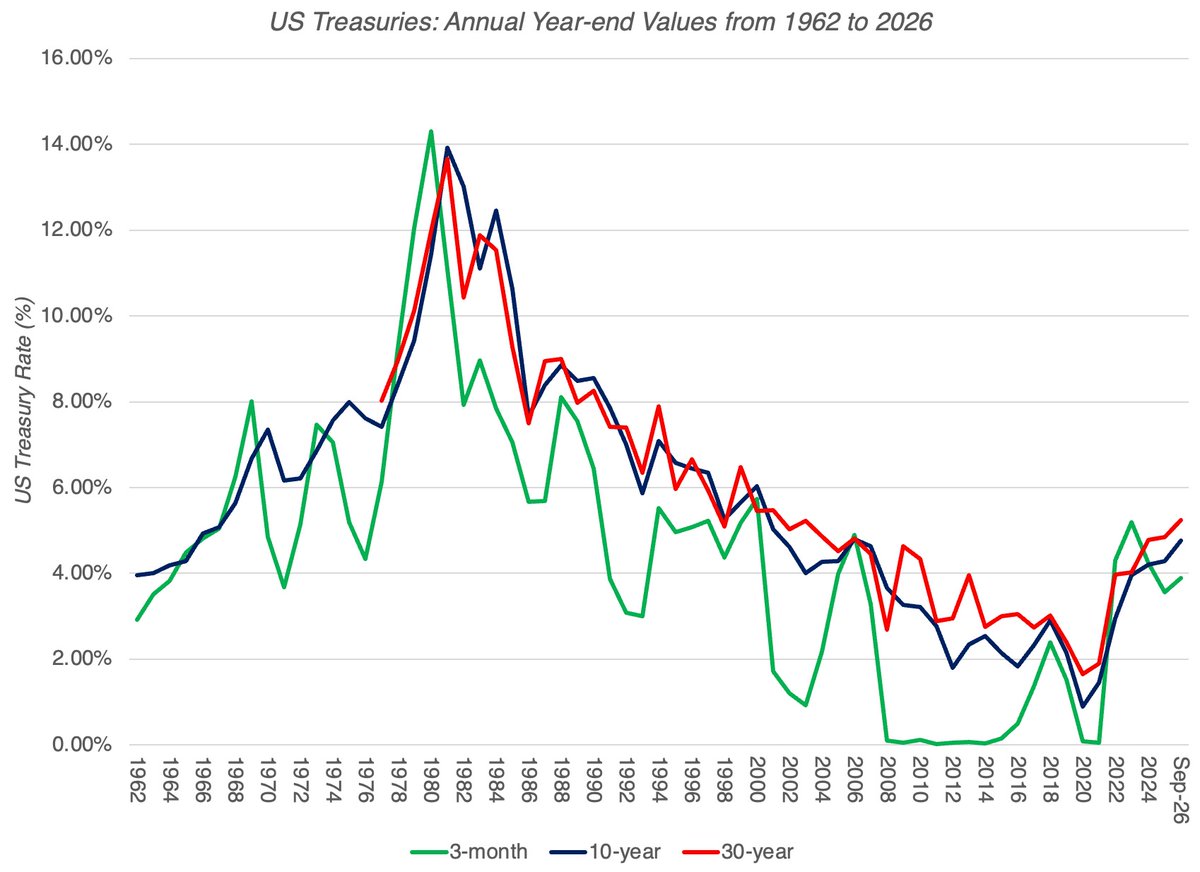
While the rise in rates puts investors who started in markets after 2008 on new ground, a longer period perspective on rates suggests that rates today have brought us closer to the norm, after a long period (2009-2021) of abnormally low rates. https://t.co/SrfO3u4Mc5 https://t.co
7.3K views · 34 likes · 0 reposts · 1 replies Open on X →
US treasury rates have been on the rise in 2026, slowly but surely, with long term treasury rates rising more than short term rates, and hitting two-decades long highs. https://t.co/SrfO3u4Mc5 https://t.co/cwwhfdOI5c
13.3K views · 50 likes · 2 reposts · 4 replies Open on X →
On a trading day when interest rates are moving markets, I look at rising rates in 2026, hazard a guess as to why they are rising, and make a stab at explaining the resilience of equities in the face of rising rates, with nary a mention of the Fed. https://t.co/SrfO3u4Mc5 194.7K views · 651 likes · 94 reposts · 23 replies Open on X →
I use this Vinod Khosla tweet with apologies to Vinod, since tweets are often out-of-context or emotive, to launch a discussion on the trade-off between scaling up and building business models (profitability) that every business faces. https://t.co/KZSXWPEXK7 https://t.co/r6vXexZ 87K views · 526 likes · 39 reposts · 15 replies Open on X →
The spotlight was on US treasuries, in August 2026, as 10-year and 30-year rates edged towards highs not seen since 2008. US equities still had a good month, with the S&P up 2.6%, pushing the equity risk premium down to 4.09%. https://t.co/NVHfXGQF7s https://t.co/v7jsE7sUV4 62.1K views · 272 likes · 34 reposts · 10 replies Open on X →
@AswathDamodaran Cisco never got back to its March 2000 high. The buildup winners and the business winners are different stocks. 414 views · 1 likes · 0 reposts · 0 replies Open on X →
I developed this framework to make sense of the AI debate, but I am clear eyed about what it will not and will do. It will not price companies for me or tell me what the TAM for AI is, but I can use it to estimate both. https://t.co/q4WKRGNGhr 13.6K views · 37 likes · 3 reposts · 2 replies Open on X →
You can use the linked spreadsheet to back out what you will need in revenues to justify the pricing of any AI company or the cap ex of any hyperscaler. https://t.co/D29xkTLjAa 13.9K views · 28 likes · 1 reposts · 2 replies Open on X →
With Anthropic, allowing for 30% after-tax operating margins and a cost of capital of 10%, you will need $1.2 trillion in revenues if the business matures in ten years and $2 trillion if you have to wait 15 years. https://t.co/CuCG8ZjefQ 5.4K views · 22 likes · 4 reposts · 1 replies Open on X →
Looking at AI as a consolidated business, and using a melded after-tax operating margin of 20%, you will need $5 trillion in revenues in year 10 to justify a pricing today of $5 trillion and almost $8 trillion if it will take 15 years. https://t.co/fyWSs4qSvB 5.3K views · 20 likes · 2 reposts · 1 replies Open on X →
If your immediate concern is deciding whether Anthropic is worth $2 trillion (rumored IPO pricing) or whether the hyper scalers will make back their money on $2 trillion plus in cap ex, you can try reverse engineering how much revenue you will need to break even at those prices. 6.3K views · 26 likes · 3 reposts · 1 replies Open on X →
The profitability of AI products will depend on business models adopted by AI businesses, with usage beating out subscription, and unit economics where lower token cost effects are being offset by token usage in more powerful models. https://t.co/q4WKRGNGhr https://t.co/KdvpRLieG 6.6K views · 24 likes · 1 reposts · 1 replies Open on X →
AI is creating a backlash because of its real estate footprint, worries about data privacy and job loss and concerns that it will make income inequality worse, and it will show up as restrictions, constraints and taxes for AI businesses. https://t.co/q4WKRGNGhr 6.2K views · 21 likes · 1 reposts · 2 replies Open on X →
The total market size for AI will depend on whether you think it is tool or employee replacement, whether it will target just high-priced employees or all of them, and its reach across industries and geographies. https://t.co/q4WKRGNGhr https://t.co/6aW8NZtmry 8.9K views · 34 likes · 3 reposts · 3 replies Open on X →
The components that go into building a business are universal, and start with an assessment of where revenues will go, what profitability will look like & how much reinvestment will be needed to get to your destination. https://t.co/q4WKRGNGhr https://t.co/HI31shQVMB 12.7K views · 33 likes · 2 reposts · 1 replies Open on X →
While there is room for disagreement, there are hard limits on how big the AI market can be, with total operating expenses at all companies last year and total wages paid to employees by all businesses as limiting points. https://t.co/q4WKRGNGhr https://t.co/YN50mFzpqf 7.6K views · 29 likes · 2 reposts · 2 replies Open on X →

Im Vergleich zu Konten gleicher Größe

47 Beiträge aus den letzten 90 Tagen, verglichen mit der Größenklasse 100K–1M Follower. liegt bei Reichweite und Interaktion unter vergleichbaren Konten.

Medianaufrufe5 444dieses Konto5 983Median für 100K–1M
Reichweite, %1.06%dieses Konto1.49%Median für 100K–1M
Interaktion, %0.46%dieses Konto0.93%Median für 100K–1M
KennzahlDieses KontoMedian für 100K–1MVerhältnis
Medianaufrufe pro Beitrag5 4445 9830.91×
Reichweite (Aufrufe ÷ Follower)1.06%1.49%0.71×
Interaktionsrate0.46%0.93%0.50×

Weitere Konten dieser Größe →   Mit einem anderen Konto vergleichen →   Wie diese Vergleichswerte entstehen →

Growth & engagement

How the posts we collected actually performed: views and reaction rate post by post, what the audience did with them, and where the follower count goes.

Views per post

4.5K10 Sep
4.1K
3.5K
3.1K
3.5K
3.1K
3.2K
2.8K
2.4K
2.6K
2.4K
9.9K
10.2K
1.3K

Last 14 collected posts, oldest on the left. The scale is logarithmic: one post can outrun the rest a hundred times over.

Engagement rate per post

0.62%10 Sep
0.82%
0.51%
0.68%
0.60%
0.72%
1.02%
1.07%
0.99%
0.46%
0.80%
0.51%
0.20%
0.38%

Reactions — likes, reposts, replies and quotes — divided by views. Median for 100K–1M accounts is 0.93%.

What the audience does

Likes56.2%2 111 in total
Reposts5.5%206 in total
Replies2.4%89 in total
Quotes0.3%12 in total
Bookmarks35.7%1 341 in total

Share of every reaction we collected for this account. Replies mean argument, reposts mean endorsement, bookmarks mean the post was worth keeping.

The follower curve appears once this account has two daily snapshots — we take one a day, and this one is on its first.

Ähnliche Konten