tweetindex
DE

NOAA ✓

@NOAA · USA (Formerly @usNOAAgov) · joined 09 Apr 2008

NOAA provides science, service and stewardship to protect life, property & Earth's natural resources. An agency of @CommerceGov. Join us on Instagram & Facebook

1 363 019Followers
162Following
21 235Posts total
734.6KViews on collected posts

Neueste Beiträge

Wishing a #HappyFall to all ... in the Northern Hemisphere 25.1K views · 187 likes · 43 reposts · 13 replies Open on X →
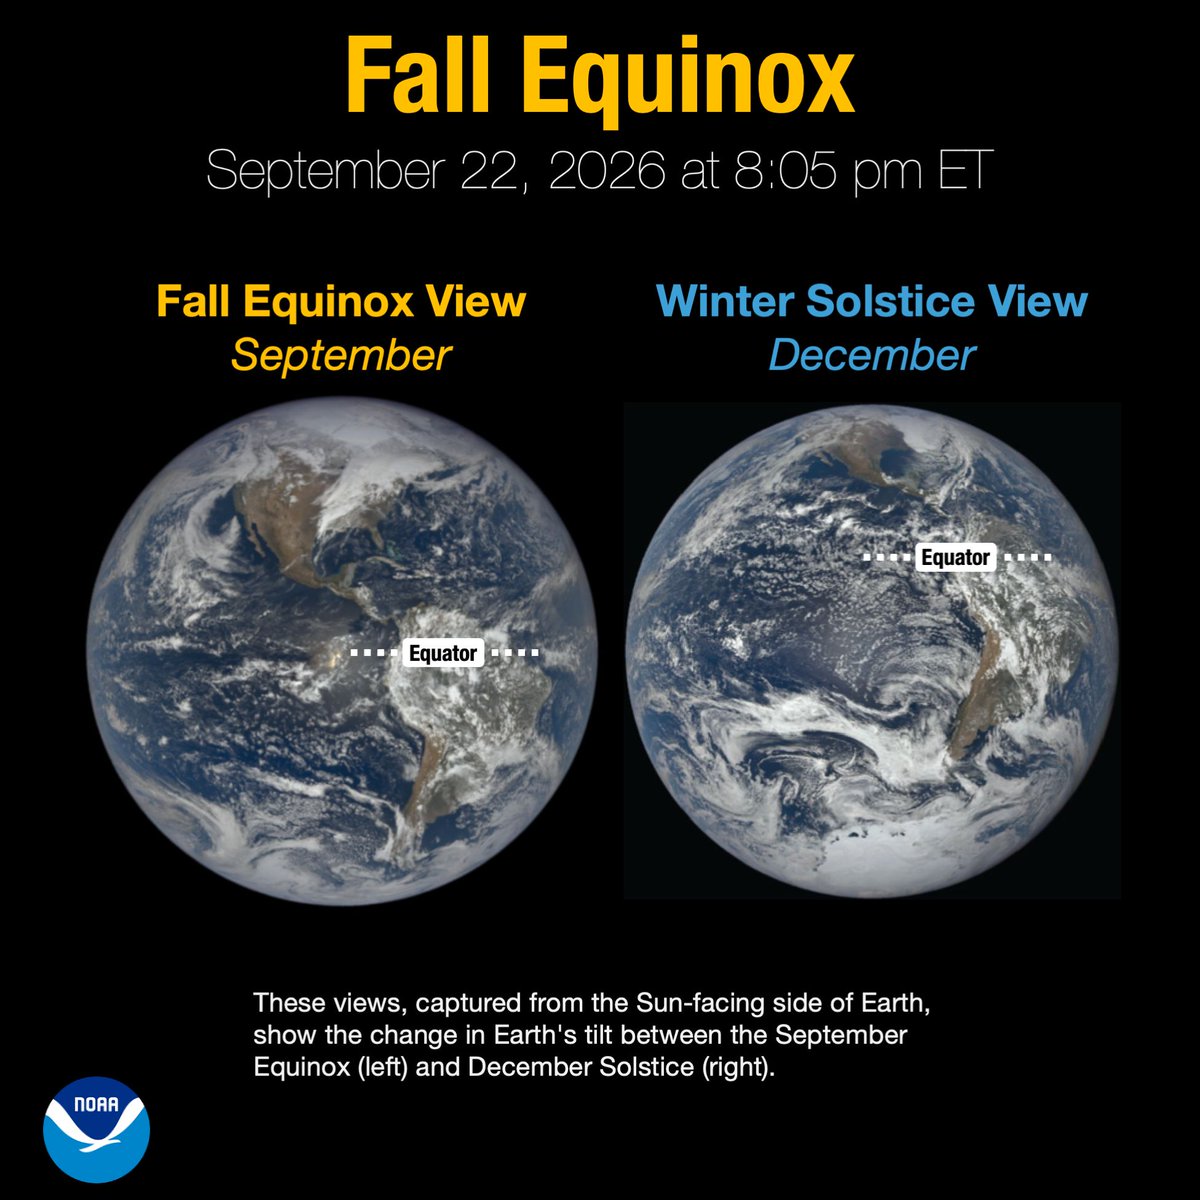
Fall arrives today at 8:05 pm ET! 🍂 Today’s Fall Equinox marks the start of astronomical fall in the Northern Hemisphere and is the moment when the Sun is directly over Earth’s equator. From now through the Winter Solstice on December 21, the Northern Hemisphere will receive htt
93.2K views · 1.3K likes · 494 reposts · 13 replies Open on X →
Today our *GLOBAL* Monthly Temperature and Precipitation report is out ... this time for August /Summer 2026. Get the highlights at the link below, via @NOAANCEI 32.3K views · 198 likes · 170 reposts · 29 replies Open on X →
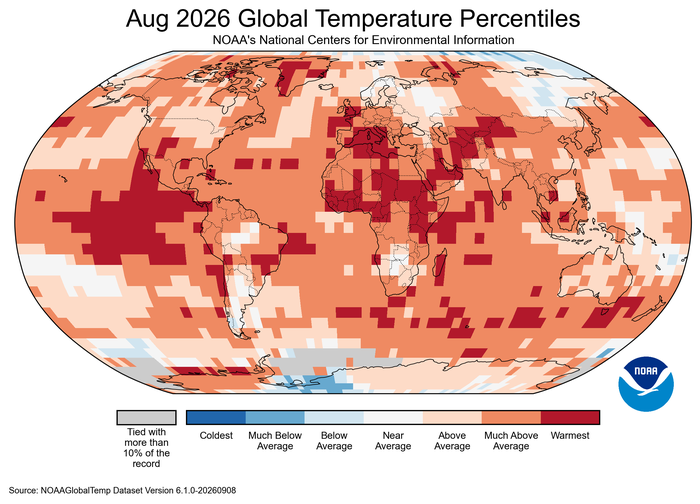
🌎 Earth experienced its warmest August on record! Our latest global report for August 2026 is now available. In honor of Swap Ideas Day, tell us about your record warm August and read the full report here: https://t.co/FSWGuupTE3 https://t.co/jGoSSE9XSL
Map of the global temperature percentiles for August 2026 with warmer areas in gradients of red and orange, cooler areas in gradients of blue and gray indicates that it tied with more than 10% of the record.
48.6K views · 171 likes · 177 reposts · 3 replies Open on X →
Our Monthly Temperature and Precipitation Report is out again, this time for August/Summer 2026. Here are the highlights: 25.7K views · 111 likes · 129 reposts · 7 replies Open on X →
It’s official: 2026 dropped the mic and had the warmest summer on record for the contiguous U.S. How did you manage to stay cool during this historic summer? Learn more about the August U.S. Report here: https://t.co/fi12yxK3Wl https://t.co/9oom9BxwoX
Map of the U.S. showing precipitation percentiles for August 2026 with wetter areas in gradients of green and drier areas in gradients of brown.
Map of the U.S. showing temperature percentiles for summer (June–August) 2026 with warmer areas in gradients of red and cooler areas in gradients of blue.
70.5K views · 332 likes · 246 reposts · 40 replies Open on X →
Will you be in the D.C. area on Saturday 9/26? Come to NOAA: Centuries of Science— A Pop-Up Experience! See some of NOAA’s most impressive artifacts, participate in hands-on activities, and more! Learn more and register at https://t.co/958ru7YoAK! #NOAAHeritageWeek https://t.co/8
20.3K views · 115 likes · 157 reposts · 4 replies Open on X →
It's #SanctuarySeptember at NOAA -- Have you visited one of these spectacular protected marine areas? 20.5K views · 36 likes · 20 reposts · 10 replies Open on X →
ICYMI -- for today, 9/3/26 20.2K views · 10 likes · 6 reposts · 3 replies Open on X →
Tomorrow (Thursday, September 3rd) Weather Outlook Scattered severe thunderstorms are possible extending from the Upper Midwest to the Mid-Atlantic. Meanwhile, heavy rainfall associated with T.D. Edouard and its remnants is expected to linger across eastern TX and bring https://
National forecast chart valid Thursday, September 3rd
56K views · 113 likes · 33 reposts · 2 replies Open on X →
Heads up, undergrads! We've got a fantastic opportunity for you ... Be selected for the next class of #NOAAScholars 🏅 ! See application information & deadlines 👇 31.2K views · 28 likes · 5 reposts · 1 replies Open on X →
The application for the 2027 NOAA Hollings undergraduate scholarship is now open until January 31, 2027! Learn more about the program and check out our resources for applicants: https://t.co/AoUODzJQwd #NOAAScholars @NOAA https://t.co/5nSwPaA0jh
30K views · 15 likes · 2 reposts · 0 replies Open on X →
Happy Sanctuaries September! Did you know that America has a network of eighteen underwater parks spanning over 629,000 square miles of ocean and Great Lakes waters? We’ll be spending the month highlighting a few of the spectacular places safeguarded under the National Marine htt
A large school of fish swirl by a vibrant pink and orange coral structure.
A diver swims behind a green sea turtle.
Looking up at a lush giant kelp forest with the sun behind the canopy.
An adult and child look out at a breaching humpback whale.
24.5K views · 56 likes · 20 reposts · 1 replies Open on X →
Our Monthly *GLOBAL* Temperature and Precipitation is out again today, for July: 37K views · 52 likes · 63 reposts · 15 replies Open on X →
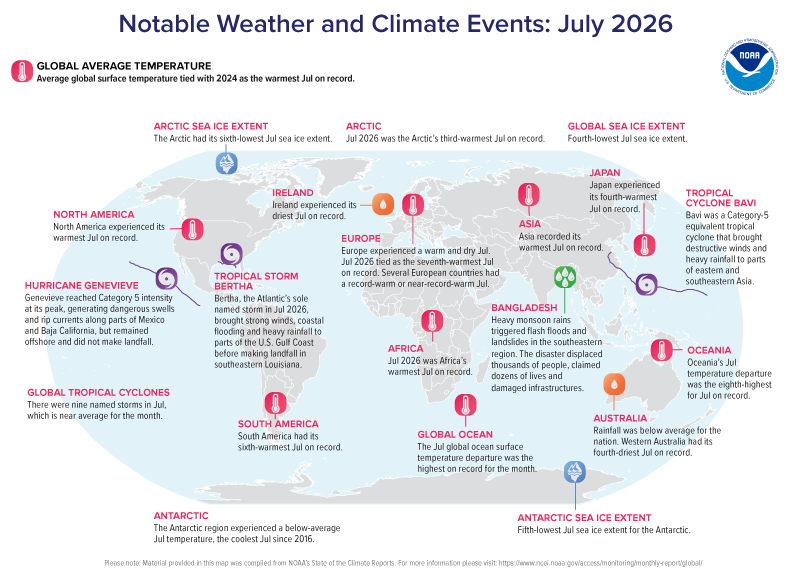
If you thought July 2026 felt like a sauna, you weren't imagining it. We just tied 2024 for the warmest July on record—ocean surface temperatures reached a record high for the month too. 🌍🌡️ Read the full report here: https://t.co/vN3LbnNN7P https://t.co/DVO9w1wH72
Map of the global temperature percentiles for July 2026 with warmer areas in gradients of red and orange, cooler areas in gradients of blue and gray indicates that it tied with more than 10% of the record.
Map of world showing locations of temperature highlights in July 2026 with text describing each event and title at top stating “Notable Weather and Climate Events: July 2026”.
50.8K views · 53 likes · 44 reposts · 5 replies Open on X →
NOAA's Monthly Temperature & Precipitation Report is out again, this time for July 2026 ... The month was a record-setter: 32.1K views · 54 likes · 14 reposts · 2 replies Open on X →
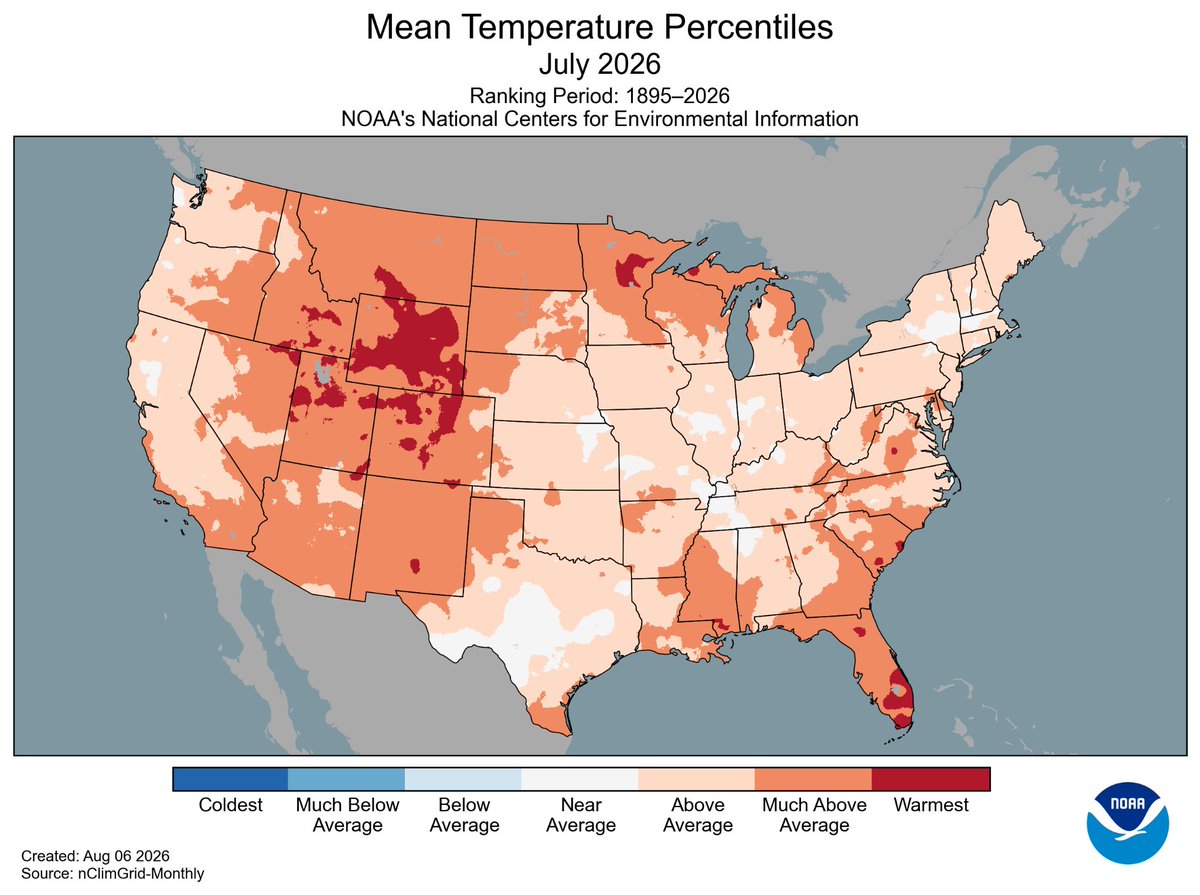
July 2026 just set a record as the warmest month ever for the contiguous U.S. (76.9°F)! 🌡️ From widespread heat to intense regional flooding, it was a wild weather month. Get the full scoop here: https://t.co/5AhUfoJkHW https://t.co/YTAiNXOKM8
Map of the U.S. showing temperature percentiles for July 2026 with warmer areas in gradients of red and cooler areas in gradients of blue.
Map of the U.S. showing precipitation percentiles for July 2026 with wetter areas in gradients of green and drier areas in gradients of brown.
52.6K views · 72 likes · 46 reposts · 9 replies Open on X →
Did you know that some Pacific hurricanes actually start in the Atlantic Ocean, off Africa? We had two the last week in July. Learn more: https://t.co/f8nLlLLFGV via @NOAASatellites https://t.co/PdQ8A5hyF2 22.5K views · 49 likes · 15 reposts · 4 replies Open on X →
JUST IN: NOAA's Atlantic Hurricane Season Outlook remains 'below normal,' in August update *U.S. residents need to remain prepared* Details: https://t.co/kxshxyagwC #HurricaneOutlook @NWS @NWSCPC https://t.co/3N9s8hrz8e 41.4K views · 135 likes · 65 reposts · 6 replies Open on X →

Im Vergleich zu Konten gleicher Größe

19 Beiträge aus den letzten 90 Tagen, verglichen mit der Größenklasse 1M–10M Follower. wird weit gezeigt, aber nur wenige dieser Zuschauer reagieren.

Medianaufrufe32 084dieses Konto14 648Median für 1M–10M
Reichweite, %2.35%dieses Konto0.74%Median für 1M–10M
Interaktion, %0.32%dieses Konto0.70%Median für 1M–10M
KennzahlDieses KontoMedian für 1M–10MVerhältnis
Medianaufrufe pro Beitrag32 08414 6482.19×
Reichweite (Aufrufe ÷ Follower)2.35%0.74%3.18×
Interaktionsrate0.32%0.70%0.46×

Weitere Konten dieser Größe →   Mit einem anderen Konto vergleichen →   Wie diese Vergleichswerte entstehen →

Growth & engagement

How the posts we collected actually performed: views and reaction rate post by post, what the audience did with them, and where the follower count goes.

Views per post

37K11 Aug
24.5K1 Sep
30K
31.2K
56K2 Sep
20.2K3 Sep
20.5K
20.3K9 Sep
70.5K
25.7K
48.6K10 Sep
32.3K
93.2K22 Sep
25.1K

Last 14 collected posts, oldest on the left. The scale is logarithmic: one post can outrun the rest a hundred times over.

Engagement rate per post

0.36%11 Aug
0.32%1 Sep
0.06%
0.11%
0.27%2 Sep
0.09%3 Sep
0.32%
1.36%9 Sep
0.90%
0.96%
0.74%10 Sep
1.23%
2.00%22 Sep
0.97%

Reactions — likes, reposts, replies and quotes — divided by views. Median for 1M–10M accounts is 0.70%.

What the audience does

Likes57.3%3 088 in total
Reposts32.5%1 749 in total
Replies3.1%167 in total
Quotes2.1%113 in total
Bookmarks5.0%270 in total

Share of every reaction we collected for this account. Replies mean argument, reposts mean endorsement, bookmarks mean the post was worth keeping.

Followers by day

22 Sep

Daily snapshots since 22 Sep 2026; the dashed line is the starting count.

Ähnliche Konten