tweetindex
DE

NOAA Atlantic Oceanographic and Meteorological Lab

@NOAA_AOML · Miami, Florida · joined 06 Aug 2014

Atlantic Oceanographic & Meteorological Laboratory: A @NOAA research lab improving ocean services, ecosystem management, and hurricane research for the nation.

24 320Followers
240Following
3 829Posts total
77.2KViews on collected posts

Neueste Beiträge

Category 5 Hurricane Lowell! 🌀✈️ This past week, AOML completed research and operational flights in collaboration with AOC, CIMAS, NCAR, ONR, NESDIS, NWS, and other partners. Ocean and air data allows for further understanding of of hurricanes and advance forecasting! https:
0:08
221 views · 2 likes · 1 reposts · 0 replies Open on X →
A new study led by @NOAA’s AOML & CIMAS integrating reef fish monitoring surveys with advanced climate modeling indicates potential poleward shifts in suitable thermal bottom habitat for six commercialized species of reef fish along the U.S. East Coast: https://t.co/Gl3T7AOaCC ht
A bathymetric map displaying ocean depth along the U.S. East Coast continental shelf, extending from Florida north to Maine. The highlighted ocean zone uses a green-to-dark-blue gradient, with shallow light-green areas (0 meters) near the coast and deeper dark-blue sections (down to -300 meters and below) along the outer continental edge and northern offshore regions.
647 views · 8 likes · 1 reposts · 0 replies Open on X →
@NOAA_AOML Now tell us what upper atmosphere aerosol injections do to the Gulf Stream. 146 views · 6 likes · 0 reposts · 0 replies Open on X →
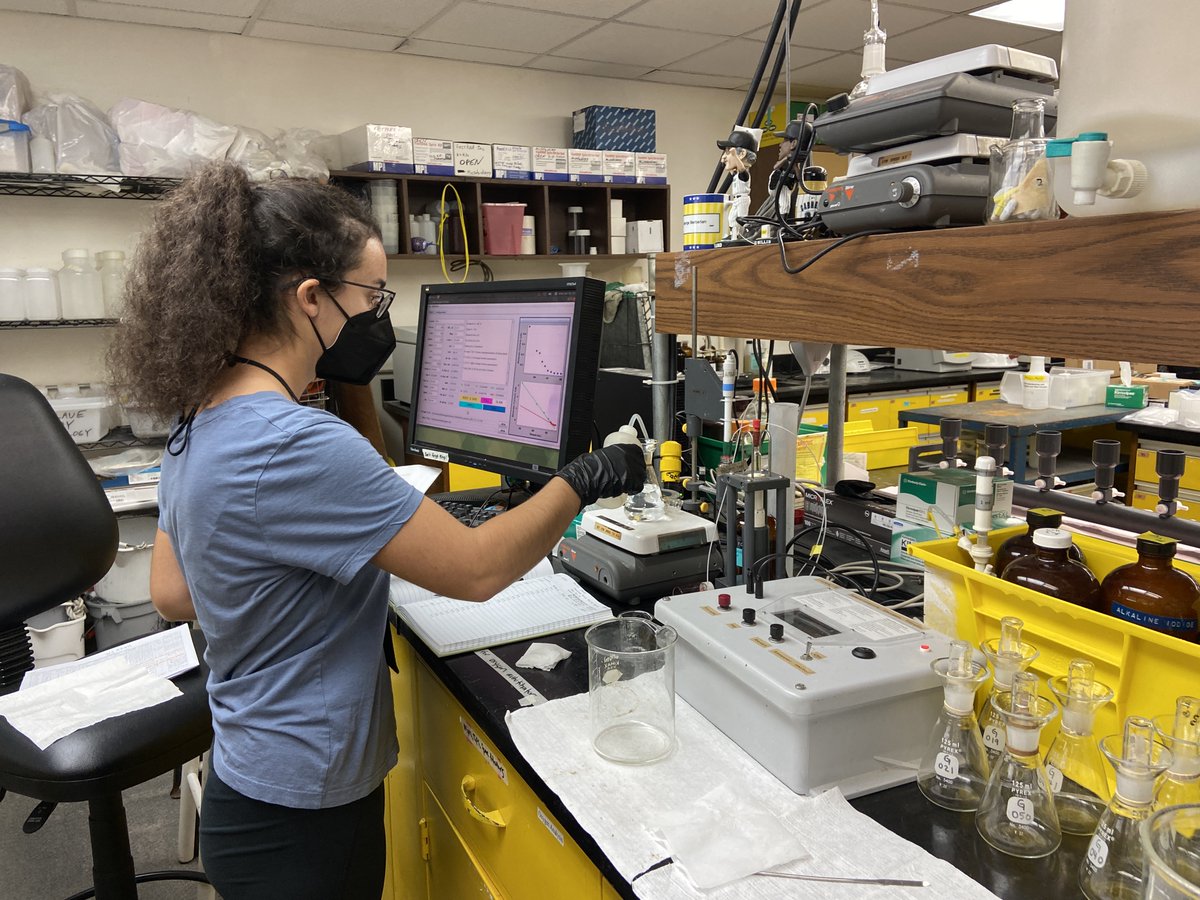
Scientists at AOML performed water quality sampling across Biscayne Bay as part of ongoing efforts to monitor changes spatially and over seasons and years to investigate the status of key ecosystems and potential impacts on public health. https://t.co/tHsWMz25r3

A zoomed-in photo of a white lab coat with dark blue lettering on the right side that reads, “Environmental Microbiology” and “Atlantic Oceanographic & Meteorological Laboratory”, with the NOAA Logo sandwiched in between.
To the left of the photo is a scientist in a blue shirt and black PPE facing the right. They are handling a water sample on a scale. The lab table has various yellow drawers and bins with equipment in them and a computer with some graphs. In the background are some shelves with more bottles and equipment.
Picture of Biscayne Bay, showing the building of the Miami skyline. The water is teal and has slight waves. The sky has white and gray fluffy clouds and is light blue.
619 views · 0 likes · 0 reposts · 0 replies Open on X →
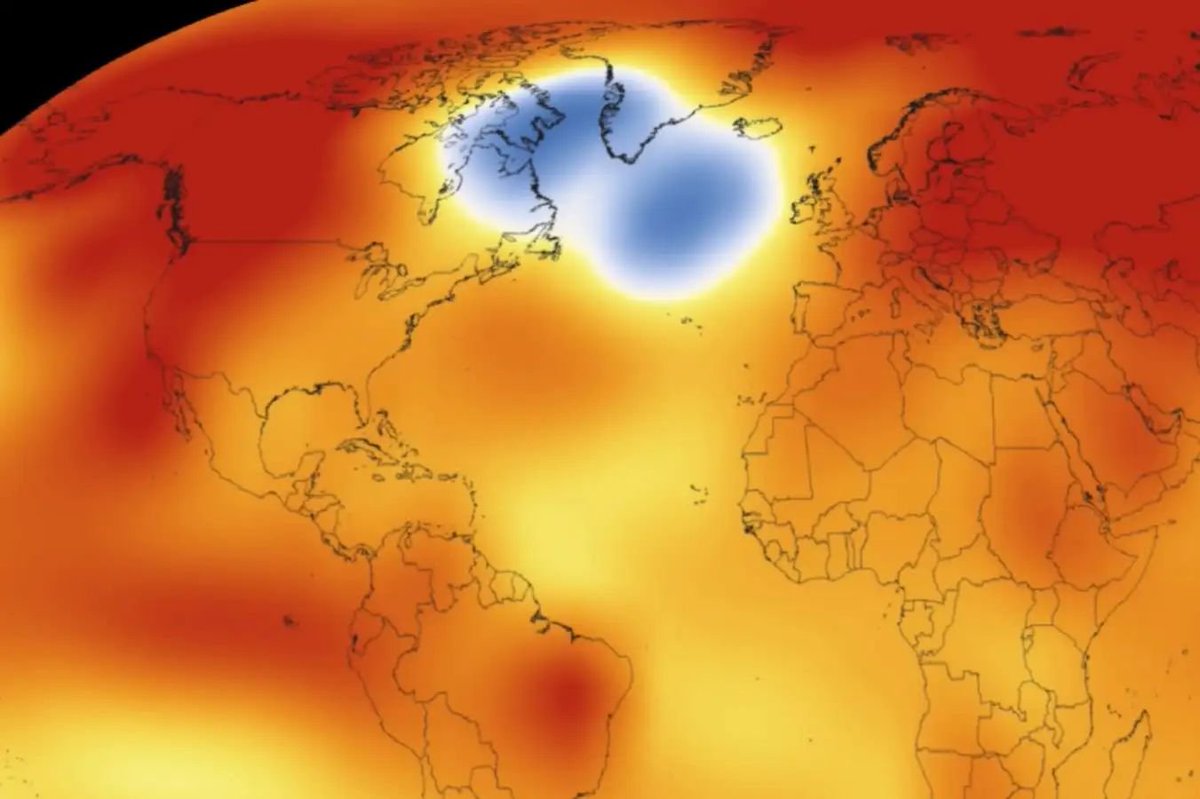
@NOAA_AOML Isn't this at odds with the cooling of the north Atlantic we've actually observed? https://t.co/FeqllOs6Xa
1.7K views · 6 likes · 1 reposts · 5 replies Open on X →
@NOAA_AOML 31 years of satellite data is a blink in ocean time. Tree rings show the North Atlantic swinging like this long before satellites existed. Natural variability hasn't gone anywhere. 1.7K views · 6 likes · 1 reposts · 0 replies Open on X →
A NOAA study reveals the Gulf Stream underwent a rapid intensification from 2014 to 2023. Fast current speed can lead to enhanced heat transport to higher latitudes, warming the upper ocean & increasing heat released to the atmosphere: https://t.co/5RgCvN5Co5 Animation: NASA htt
GIF
Image Text: Left Panel Title: "Weak Gulf Stream (2005-2014)" Right Panel Title: "Strong Gulf Stream (2016-2023)" Scale Label: "m/s"Color Scale Values: 0, 0.2, 0.4, 0.6, 0.8, 1, 1.2. Graphic: Side-by-side comparison maps showing Gulf Stream ocean current velocities along the U.S. East Coast and North Atlantic Ocean. A vertical color bar on the right measures speed in meters per second (m/s), from 0 (white/light blue) to over 1.2 m/s (dark red). Left Map (Weak Gulf Stream, 2005-2014): Shows a narrow high-velocity stream (red, orange, yellow) flowing north along the Florida coast, turning northeast near Cape Hatteras, and rapidly weakening as it extends east. Right Map (Strong Gulf Stream, 2016-2023): Displays a broader, more intense high-velocity band that maintains higher speeds farther east across the Atlantic Ocean.
71.5K views · 382 likes · 98 reposts · 14 replies Open on X →
How do scientists track ocean carbon on a global scale? Through the Ships of Opportunity Program, NOAA AOML equips ships with instruments to monitor global ocean-atmosphere CO2 exchange and track changing ocean chemistry. Learn more here: https://t.co/AREfJ8g65c https://t.co/V7
1:06
770 views · 9 likes · 1 reposts · 0 replies Open on X →

Im Vergleich zu Konten gleicher Größe

8 Beiträge aus den letzten 90 Tagen, verglichen mit der Größenklasse 10K–100K Follower. übliche Reichweite für diese Größe, schwächere Reaktion als bei den meisten.

Medianaufrufe708dieses Konto924Median für 10K–100K
Reichweite, %2.91%dieses Konto3.62%Median für 10K–100K
Interaktion, %1.00%dieses Konto1.52%Median für 10K–100K
KennzahlDieses KontoMedian für 10K–100KVerhältnis
Medianaufrufe pro Beitrag7089240.77×
Reichweite (Aufrufe ÷ Follower)2.91%3.62%0.80×
Interaktionsrate1.00%1.52%0.66×

Weitere Konten dieser Größe →   Mit einem anderen Konto vergleichen →   Wie diese Vergleichswerte entstehen →

Growth & engagement

How the posts we collected actually performed: views and reaction rate post by post, what the audience did with them, and where the follower count goes.

Views per post

77027 Aug
71.5K2 Sep
1.7K3 Sep
1.7K
619
1464 Sep
647
2219 Sep

Last 8 collected posts, oldest on the left. The scale is logarithmic: one post can outrun the rest a hundred times over.

Engagement rate per post

1.30%27 Aug
0.69%2 Sep
0.42%3 Sep
0.71%
0.00%
4.11%4 Sep
1.39%
1.36%9 Sep

Reactions — likes, reposts, replies and quotes — divided by views. Median for 10K–100K accounts is 1.52%.

What the audience does

Likes65.4%419 in total
Reposts16.1%103 in total
Replies3.0%19 in total
Bookmarks15.6%100 in total

Share of every reaction we collected for this account. Replies mean argument, reposts mean endorsement, bookmarks mean the post was worth keeping.

The follower curve appears once this account has two daily snapshots — we take one a day, and this one is on its first.

Ähnliche Konten

Frequently asked questions about @NOAA_AOML

How many followers does @NOAA_AOML have?

24 320 followers.

How many posts has @NOAA_AOML published?

3 829 posts.

How do posts by @NOAA_AOML perform?

Collected posts: 8. Views: 77 229. Likes: 419.