tweetindex
ES

Stephen Miran

@SteveMiran

Citizen of the United States of America 🇺🇸

54 110Followers
972Following
18 537Posts total
155.2KViews on collected posts

Últimas publicaciones

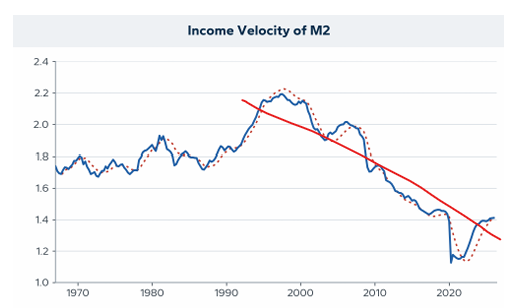
@SteveMiran @Nouriel @PIrelandEcon The paper says money can safely grow 5% a year — 3% for real growth plus 2% for target inflation. That arithmetic quietly assumes trend velocity stops moving from now on. It never has. If velocity keeps falling at its 2000–2019 pace (roughly 2% 322 views · 2 likes · 0 reposts · 0 replies Open on X →
Once again the link https://t.co/SIbF4dqT4A 2.8K views · 10 likes · 2 reposts · 2 replies Open on X →
Monetarist analysis would have served the FOMC well after the pandemic, and we hope it gets added to the toolkit longer term. 2.7K views · 12 likes · 0 reposts · 1 replies Open on X →
4) With money growth approximately neutral at present, an acceleration from here that reopens a positive price gap would make it appropriate to tighten policy. 965 views · 5 likes · 0 reposts · 1 replies Open on X →
This all is intended as a useful cross-check on what other models are saying. There will remain uncertainty over velocity. But this is useful information and should not be discarded, and monetary analysis deserves a place in monetary policy. 1.1K views · 2 likes · 0 reposts · 1 replies Open on X →
This all is intended as a useful cross-check on what other models are saying. There will remain uncertainty over velocity. But this is useful information and should not be discarded, and monetary analysis deserves a place in monetary policy. 1K views · 5 likes · 0 reposts · 1 replies Open on X →
IOW, the monetary aggregates themselves do not indicate that monetary policy is "too loose" unless you need monetary policy to exert disinflationary pressure offsetting persistent supply shocks. (net supply shocks, not offset by other supply shocks; AI+dereg productivity matter) 983 views · 6 likes · 0 reposts · 1 replies Open on X →
3) Therefore, a call on current appropriate monetary policy will depend on your views of whether the current factors boosting inflation--supply shocks, measurement issues, AI spillovers, whatever--prove persistent or not, and require monetary policy to be restrictive to combat 1K views · 5 likes · 0 reposts · 1 replies Open on X →
It also means that to the extent "monetarist" and "money supply" are synonymous with a "hard money" approach, that approach is currently well positioned to deal with inflation. 858 views · 4 likes · 0 reposts · 1 replies Open on X →
Note that this is consistent with the M2 box from Friday's monetary policy report as well - the Fed observed that growth rates of M2 were pretty normal (and to the extent they resembled those of the 2010s, nothing to worry about). Divisia aggregates agree https://t.co/CUfLUC2S3X
933 views · 5 likes · 0 reposts · 1 replies Open on X →
2) Currently, monetarist analysis does NOT indicate high inflation will be persistent. This suggests monetary policy is not responsible for current high inflation An explanation for persistent high inflation must come from outside monetary analysis (say, you think oil keeps ↗️) 1K views · 8 likes · 1 reposts · 1 replies Open on X →
Critically, P* is a reduced form model: it's agnostic with respect to the origin of money growth. That growth could be of monetary policy, fiscal, or other origin; it merely indicates money supply's pressures on inflation. It thus embeds fiscal explanations for inflation. 979 views · 4 likes · 0 reposts · 1 replies Open on X →
What does all this mean? 1) Monetary aggregates and P* did a great job forecasting higher inflation, then lower inflation, after the pandemic. Policymakers would have been well served to heed them. 1K views · 6 likes · 0 reposts · 1 replies Open on X →
After the pandemic, monetary aggregates indicated significant latent inflationary pressure which suggested high inflation would be sharp and persistent. After the Fed tightened, they indicated significant disinflationary pressure. 1K views · 6 likes · 0 reposts · 1 replies Open on X →
At present, no matter how we calculate them, price gaps are about zero. That means, from a monetarist perspective, monetary policy is currently pretty neutral in its effects on inflation. Note this was NOT the case after the pandemic! https://t.co/Zkj6X3GvaB
13.8K views · 12 likes · 0 reposts · 3 replies Open on X →
We find gamma = 0.1 in updated data, meaning a 1% price gap will boost quarterly inflation by 10 bps annualized. https://t.co/asPPsLHS6x
1.3K views · 4 likes · 0 reposts · 1 replies Open on X →
(The model with Divisia also did a nice job after the GFC indicating sustained deflationary pressure even with rates at zero and simple-sum money exploding! - addressing a common criticism of monetarism of wild failure after the GFC) https://t.co/cD8lzmQck7 2K views · 5 likes · 0 reposts · 1 replies Open on X →
Rewrite this as MV* = P*Y* where * denotes long-term. If you make assumptions about potential output (Y*) and use time-series methods to estimate V*, and you know current money supply, you can imply P*. 1.2K views · 4 likes · 0 reposts · 1 replies Open on X →
The classic approach is then to take the "price gap" - current prices relative to the implied P* and use it to forecast inflation. This embeds a nice new-Keynesian concept: prices don't adjust immediately! If P<P*, there's latent inflationary pressure, and vice versa. 1.4K views · 5 likes · 1 reposts · 1 replies Open on X →
Next, we employ the P* model on Divisia aggregates to bring us up to the present. The P* model was developed at the behest of Warsh's hero, Alan Greenspan. It starts from the basic quantity equation, MV=PY, and then uses long-term concepts. 1.3K views · 6 likes · 0 reposts · 1 replies Open on X →
That makes velocity stabler in Divisia aggregation than simple-sum aggregation, restoring forecast usefulness. See this comparison, for instance. There's now a literature on using Divisia aggregates for forecasting, finding them very powerful, which we survey. https://t.co/AVMb
1.4K views · 10 likes · 0 reposts · 1 replies Open on X →
Just as housing receives a larger weight than video games in a price index, checking accounts receive a larger weight in Divisia than Treasury bills. This helps account for financial innovations which change the patterns and uses of money demand. 1.4K views · 5 likes · 0 reposts · 1 replies Open on X →
In the last decade, there's been a healthy revival of research to rescue monetarism from the instability of velocity. It's centered around Divisia monetary aggregates, named after French economist Francois Divisia. Divisia differs from simple-sum aggregates through weighting. 1.5K views · 11 likes · 0 reposts · 1 replies Open on X →
Rather than just add a bunch of types of money together, Divisia approaches weigh them by how moneylike they are, or in economist jargon, their provision of liquidity services. They're combined into an index, like we measure inflation. 1.4K views · 6 likes · 0 reposts · 1 replies Open on X →
As is well known, velocity fluctuated over time! Thus MV=PY stopped effectively forecasting PY. And then the transition to ample- and abundant-reserves settings with administered rates meant manipulating money supply was no longer even viewed as a transmission mechanism. 2.1K views · 8 likes · 1 reposts · 1 replies Open on X →
Velocity became unstable because of financial innovations: shifts to newer forms of money which were less transactional and more store-of-value (e.g. MMMFs). Relative to currency, an increase in MMMF holdings doesn't signal a large increase in transactions and therefore NGDP 1.6K views · 6 likes · 0 reposts · 1 replies Open on X →
In the paper, we briefly review the rise and fall of monetarism at the Fed. What started as a shrinking role for money supply in analysis turned into total disappearance, even to the point that managing money supply no longer plays a meaningful role in implementation. 1.7K views · 6 likes · 1 reposts · 1 replies Open on X →
Indeed, there's already some evidence this is happening! Friday's FRB monetary policy report contained a section on M2 growth, with some commentary that growth rates and velocity were in line with pre-pandemic experience https://t.co/nlCTzxupgC
2.6K views · 12 likes · 1 reposts · 1 replies Open on X →
To be clear, we don't think Warsh wants early-Friedman-style targeting of monetary growth. Nor do we think that's wise! Rather, we claim: monetary aggregates contain useful information for forecasting inflation, and that information shouldn't be discarded, as previously done 3.3K views · 13 likes · 0 reposts · 1 replies Open on X →
Indeed, Warsh has been on the record numerous times saying "money matters," "the quantum and velocity of money have important bearing on the price level" and, in part, blaming the egregious inflation errors post-pandemic on the Fed's overlooking money https://t.co/SIbF4dqT4A 9.1K views · 30 likes · 5 reposts · 2 replies Open on X →

Frente a cuentas del mismo tamaño

31 publicaciones de los últimos 90 días, junto al rango de 10K–100K seguidores. por debajo de sus pares en alcance y en interacción.

Visualizaciones medianas1 387esta cuenta1 072mediana de 10K–100K
Alcance, %2.56%esta cuenta3.86%mediana de 10K–100K
Interacción, %0.51%esta cuenta1.70%mediana de 10K–100K
MétricaEsta cuentaMediana de 10K–100KProporción
Visualizaciones medianas por publicación1 3871 0721.29×
Alcance (visualizaciones ÷ seguidores)2.56%3.86%0.66×
Tasa de interacción0.51%1.70%0.30×

Otras cuentas de este rango →   Comparar con otra cuenta →   Cómo se construyen estas referencias →

Growth & engagement

How the posts we collected actually performed: views and reaction rate post by post, what the audience did with them, and where the follower count goes.

Views per post

1K13 Jul
1K
979
1K
933
858
1K
983
1K
1.1K
965
2.7K
2.8K
322

Last 14 collected posts, oldest on the left. The scale is logarithmic: one post can outrun the rest a hundred times over.

Engagement rate per post

0.69%13 Jul
0.69%
0.51%
0.96%
0.64%
0.58%
0.60%
0.71%
0.60%
0.28%
0.62%
0.48%
0.49%
0.62%

Reactions — likes, reposts, replies and quotes — divided by views. Median for 10K–100K accounts is 1.70%.

What the audience does

Likes70.1%223 in total
Reposts3.8%12 in total
Replies10.4%33 in total
Quotes1.3%4 in total
Bookmarks14.5%46 in total

Share of every reaction we collected for this account. Replies mean argument, reposts mean endorsement, bookmarks mean the post was worth keeping.

The follower curve appears once this account has two daily snapshots — we take one a day, and this one is on its first.

Cuentas similares