tweetindex
FR

Molly White ✓

@molly0xFFF · she/her 💗💜💙 · joined 04 Apr 2012

bsky: @​https://t.co/jJXL8GfoBs crypto & tech industry researcher & critic at https://t.co/hb1tT2Q3bJ & @web3isgreat support my work: https://t.co/FPG3uvikH0

121 764Followers
2 064Following
22 343Posts total
702.5KViews on collected posts

Derniers posts

“WAGMI” — we're all gonna make it — was crypto's 2021 rallying cry. But those with wealth and power knew it was a lie, and that “all” just meant them. My latest piece traces the last five years, from hype to technoligarchy — and why they're not all gonna make it either. https://t 35.4K views · 224 likes · 65 reposts · 13 replies Open on X →
next issue of Citation Needed will be out tomorrow, and thank you to everyone who didn’t unsubscribe when i dropped off the face of the planet into a COVID hole! (the joys of being a solo writer) 9.9K views · 112 likes · 5 reposts · 4 replies Open on X →
i love the beginning of the year because everyone starts blogging. and if you (yes you) were thinking about starting, this is your sign 7.9K views · 51 likes · 6 reposts · 2 replies Open on X →
@molly0xFFF is there a list somewhere of all the crypto games that were "coming soon" 3-5 years ago? 4.8K views · 43 likes · 0 reposts · 1 replies Open on X →
i love the implication that crypto gaming was fundamentally sound and only died because VCs failed to manifest it https://t.co/d5TpHQCOEB 13.1K views · 319 likes · 16 reposts · 12 replies Open on X →
so it’s going well then https://t.co/xcoElsYrZb 13K views · 280 likes · 6 reposts · 2 replies Open on X →
checking out the crypto gaming magazine’s 2026 “most anticipated” list to see how blockchain gaming has been going https://t.co/GEBKdxzHTH 75.5K views · 3.3K likes · 126 reposts · 15 replies Open on X →
when i first saw this video i thought it was ross ulbricht 12.1K views · 52 likes · 4 reposts · 2 replies Open on X →
Even a crypto proponent who otherwise seemed excited about the report pointed this out. a16z hasn't replied to their question since they asked it a month ago. https://t.co/iH7aeqrEuf 23.3K views · 82 likes · 9 reposts · 2 replies Open on X →
It is accurate that the Ethereum merge massively reduced the egregious energy costs of the Ethereum blockchain. But a16z has resorted to outright lies to try to shift the conversation towards electricity costs of services like YouTube, rather than that of Bitcoin and other PoW. 14.8K views · 83 likes · 5 reposts · 3 replies Open on X →
The worst slide in the deck is the one that claims Ethereum now uses 94,000x less electricity than YouTube, a comparison they pick to avoid impugning Bitcoin. However, this data is based on some incredibly shabby math and bad sourcing by a low-quality popsci blog. https://t.co/l
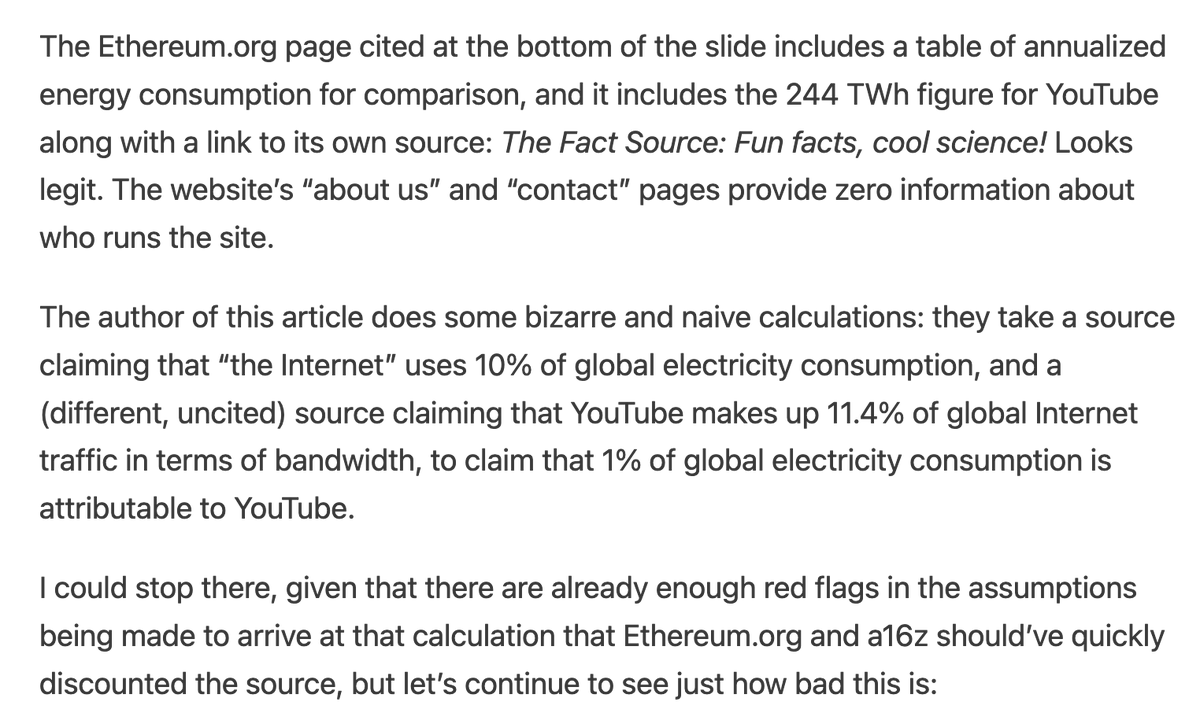
The Ethereum.org page cited at the bottom of the slide includes a table of annualized energy consumption for comparison, and it includes the 244 TWh figure for YouTube along with a link to its own source: The Fact Source: Fun facts, cool science! Looks legit. The website’s “about us” and “contact” pages provide zero information about who runs the site.

The author of this article does some bizarre and naive calculations: they take a source claiming that “the Internet” uses 10% of global electricity consumption, and a (different, uncited) source claiming that YouTube makes up 11.4% of global Internet traffic in terms of bandwidth, to claim that 1% of global electricity consumption is attributable to YouTube.

I could stop there, given that there are already enough red flags in the assumptions being made to arrive at that calculation that Ethereum.org and a16z should’ve quickly discounted the source, but let’s continue to see just how bad this is:
According to Swedish KTH Royal Institute of Technology, the internet uses 10% of the total electricity consumption worldwide.

Where does this come from? A reputable public research university in Sweden, apparently? Let’s see:

The Fact Source cites a (dead, archived) post from March 2019 on Inside Scandinavian Business, a now-defunct magazine once focused on “helping and promoting amazing businesses within Scandinavia and the other Nordic countries”. ISB makes the same claim: “Around 10% of the world’s total electricity consumption is being used by the internet, according to a recent research report from Swedish KTH.“ They in turn cite a (Swedish, machine translated) February 2019 blog post on an economics, politics, and prepper blog called Cornucopia, which repeats: “About 10% of the world's electricity consumption is eaten up by the Internet, a research report from KTH shows.” However, in the blog post, we can see that the blog author is calculating the 10% number themselves, from e
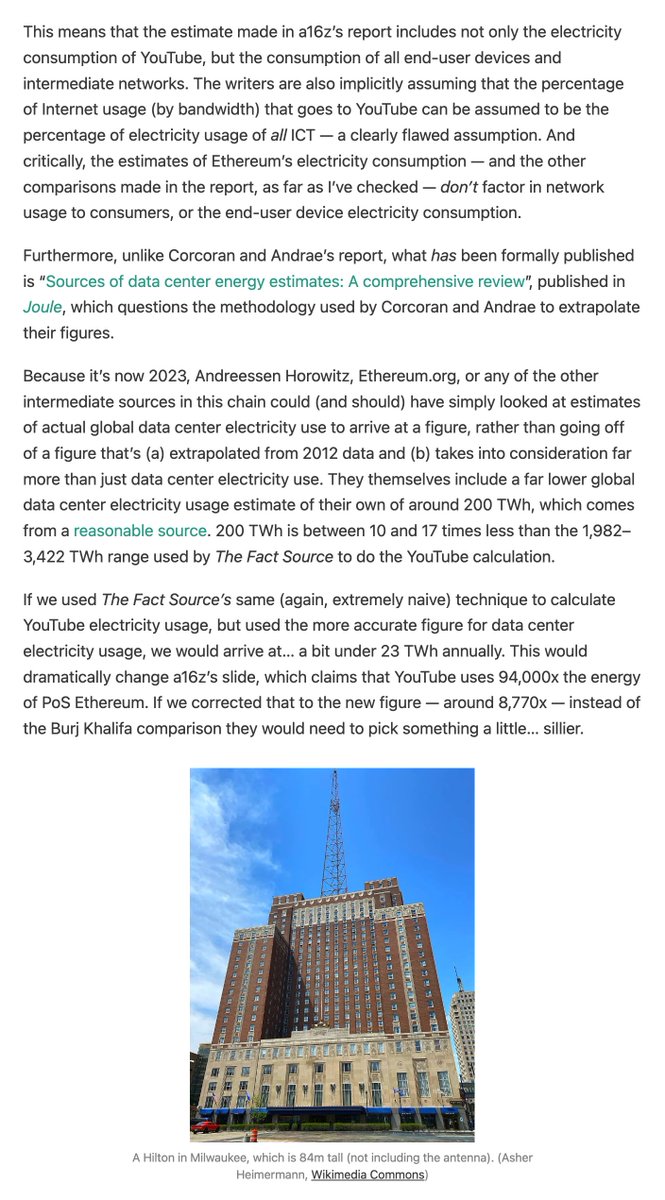
This means that the estimate made in a16z’s report includes not only the electricity consumption of YouTube, but the consumption of all end-user devices and intermediate networks. The writers are also implicitly assuming that the percentage of Internet usage (by bandwidth) that goes to YouTube can be assumed to be the percentage of electricity usage of all ICT — a clearly flawed assumption. And critically, the estimates of Ethereum’s electricity consumption — and the other comparisons made in the report, as far as I’ve checked — don’t factor in network usage to consumers, or the end-user device electricity consumption.

Furthermore, unlike Corcoran and Andrae’s report, what has been formally published is “Sources of data center energy estimates: A comprehensive review”, published in Joule, which questions the methodology used by Corcoran and Andrae to extrapolate their figures.

Because it’s now 2023, Andreessen Horowitz, Ethereum.org, or any of the other intermediate sources in this c
I’ve edited the slide to show just how erroneous the Burj Khalifa comparison turned out to be:

But as I’ve been careful to point out, this is still an extremely naive way to calculate YouTube’s electricity consumption, and still massively overestimates it.

We could instead go by something a little more reliable and see that Google’s own annual environmental report for 2022 shows they used 18.6 TWh across the entire company.21 Only a portion of all of the electricity used by Google can reasonably be attributed to YouTube, but I couldn't find more granular figures. Either way, a16z's estimated 244 TWh is off by more than an order of magnitude, and possibly even closer to two orders of magnitude — something that should have been apparent at a glance to whoever wrote the report.
17.7K views · 114 likes · 15 reposts · 4 replies Open on X →
I start by noting that this "creativity" with the numbers is not new to this year's report. However, because the price downturn was still somewhat recent in last year's, they were able to get away with some subtle manipulations that would be a lot more obvious this year. https://
With the use of some extended x-axes and creative (and undisclosed) data cut-offs, they were able to make it appear that crypto prices could still be on a rocket trajectory. For example, take this chart of “global crypto market cap”. Looks compelling! Up only, which they helpfully illustrate with the crude black arrow in case those pesky “down” portions of the graph were threatening to confuse the message.

A chart showing "Global Crypto Market Cap", with an upwards trajectory and the number "270.9%" next to it.
Portion of slide 12 from a16z’s 2022 State of Crypto report (full slide)
To their credit, they do cite their sources — in this case, CoinMarketCap. This allows us to pull the same data from the same source, as of the time at which the report was published:

Chart showing the crypto market cap from April 29, 2013 to May 17, 2022
Total Cryptocurrency Market Cap chart until May 17, 2022 (CoinMarketCap)
Hm.
I have taken the chart through May 2022, overlaid it on a16z’s, and massaged it a little bit to fit, which produces the following (note I’ve turned it into grayscale to help with visibility):


CoinMarketCap data (black rectangle) overlaid on a16z’s chart. The red dashed line marks on the CoinMarketCap chart the claimed cutoff of December 31, 2022.
This allows us to see how a16z cut off the data at roughly May 2021, despite claiming on that slide that the data was as of December 31, 2021 (marked by the red line), and despite in later slides using data through May 2022. This omission conveniently elides the downturns in mid and late 2021 that might make readers notice that “hmm, sometimes crypto prices do go down”.

This year, however, they would have to cut out about a year and a half of data to make price-related (and many other) charts look like they’re going up. That’s harder to get away with, so instead they’ve switched tacks: now they’re claiming those same dollar amounts they use
22.2K views · 82 likes · 9 reposts · 1 replies Open on X →
@molly0xFFF the #a16z creeps have now filed a comment letter filled with shrieking madness with the SEC too so sadly yr behind again. #slugsofa16z https://t.co/kN3MUj0nYA 2.9K views · 11 likes · 1 reposts · 0 replies Open on X →
If you found this critical analysis of their report valuable, consider signing up for a pay-what-you-want subscription. My writing is never paywalled, and your support goes long way to helping me continue doing this kind of work. https://t.co/MDE3XVMwP4 20.7K views · 83 likes · 6 reposts · 2 replies Open on X →
A deep dive on Andreessen Horowitz's latest "State of Crypto" report. In short: they want people to keep buying crypto, and are not above publishing blatant falsehoods to convince them to do so. The report itself is 60 pages long, so this is a long one. https://t.co/R99VabLzdy 391.5K views · 1.1K likes · 246 reposts · 26 replies Open on X →
the monsters behind some of the most obscenely exploitative schemes to ever be dreamed up in Silicon Valley's hallowed halls would like the @SECGov to know that they need to keep dumping tokens on retail otherwise they might have to make do with regular car doors. https://t.co/hA
13.1K views · 40 likes · 9 reposts · 5 replies Open on X →
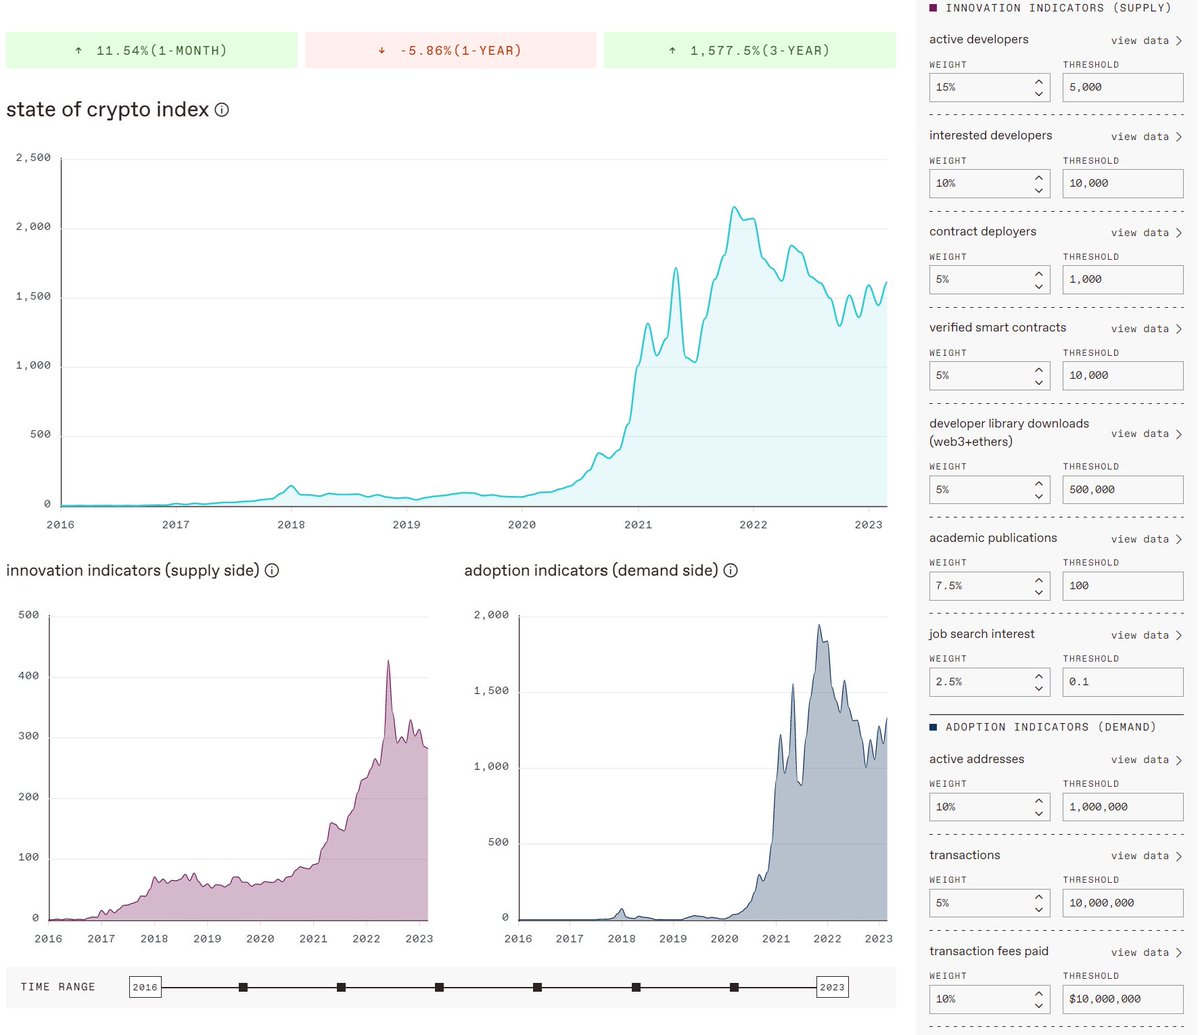
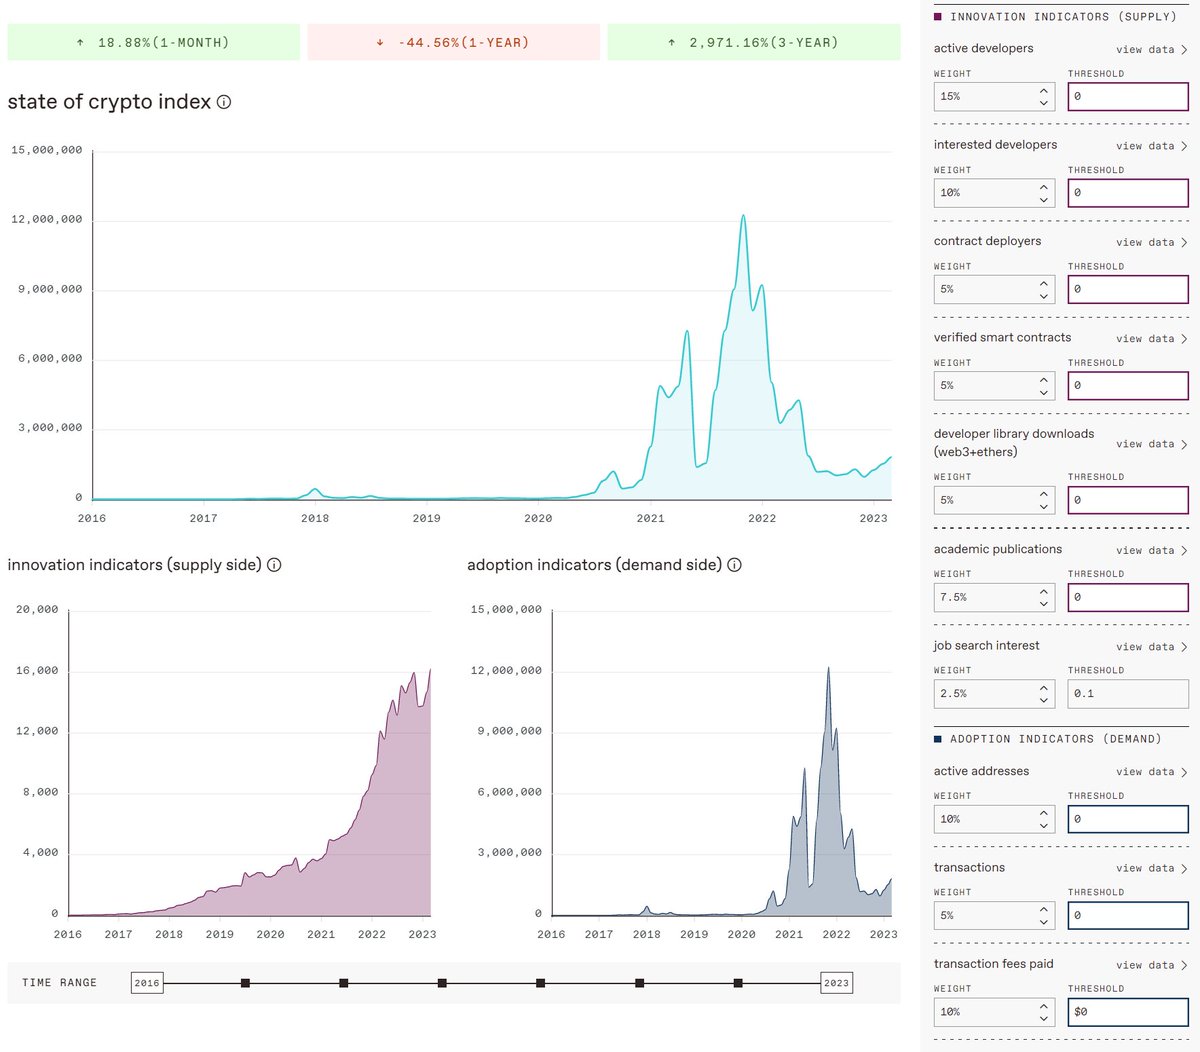
@a16zcrypto This index idea is a great idea and very needed! BUT What's the purpose of "minimum thresholds"? These appear to be arbitrary, and when removed (as I suspect they should be) the chart completely changes. It seems thresholds exist to "juke the stats" Can anyone cl
24.8K views · 30 likes · 2 reposts · 1 replies Open on X →

Growth & engagement

How the posts we collected actually performed: views and reaction rate post by post, what the audience did with them, and where the follower count goes.

Views per post

20.7K9 May
2.9K
22.2K
17.7K
14.8K
23.3K
12.1K1 Jan
75.5K4 Jan
13K
13.1K
4.8K
7.9K6 Jan
9.9K7 Jan
35.4K

Last 14 collected posts, oldest on the left. The scale is logarithmic: one post can outrun the rest a hundred times over.

Engagement rate per post

0.44%9 May
0.42%
0.41%
0.76%
0.62%
0.40%
0.48%1 Jan
4.50%4 Jan
2.24%
2.67%
0.93%
0.75%6 Jan
1.23%7 Jan
0.86%

Reactions — likes, reposts, replies and quotes — divided by views.

What the audience does

Likes83.3%5 971 in total
Reposts7.4%530 in total
Replies1.3%95 in total
Quotes0.9%62 in total
Bookmarks7.1%509 in total

Share of every reaction we collected for this account. Replies mean argument, reposts mean endorsement, bookmarks mean the post was worth keeping.

The follower curve appears once this account has two daily snapshots — we take one a day, and this one is on its first.

Comptes similaires