tweetindex
ID

Arjun Bhatia

@ArjunB9591 · Gurugram · joined 29 Sep 2016

Trader|Mentor|Businessman 💼 Founder of Arjun Motors(Royal Enfield)🏍️ & Trading With Arjun Bhatia 📈 Managed by Ono Creators

76 272Followers
1 044Following
38 647Posts total
257.9KViews on collected posts

Postingan terbaru

TradingView has moved its free users towards paid plans, making advanced charting harder to access without a subscription. But if you're trading in India, you still have an alternative. @DhanHQ continues to offer TradingView charts for free. And that's not all. You also get 2.8K views · 4 likes · 0 reposts · 2 replies Open on X →
@Meta @mosseri 391 views · 0 likes · 0 reposts · 0 replies Open on X →
Anyone working at @Meta or know someone working at meta ? One of my work Instagram account with 40k followers has been disabled without any proper reason ? Need help regarding the same. Please amplify if possible. 3.2K views · 5 likes · 1 reposts · 5 replies Open on X →
PPFCF vs Axis Large & Mid Cap — a different way to look at the numbers. Parag Parikh Flexi Cap Fund is now around ₹1.48 lakh crore AUM, while Axis Large & Mid Cap Fund is around ₹16,800 crore. But size is only one part of the story. The recent return comparison is where the 2.5K views · 3 likes · 0 reposts · 1 replies Open on X →
Tracking Aditya Birla Capital as it continues through its current consolidation phase. Added it to my portfolio and will be watching the price action closely. You can check below 👇🏻 https://t.co/lH1Dw7pIRL 2.9K views · 2 likes · 0 reposts · 0 replies Open on X →
@ArjunB9591 Indicators are dead now 220 views · 2 likes · 0 reposts · 0 replies Open on X →
However, it's important to remember that no single indicator is foolproof, and traders should always use a combination of indicators and other analysis techniques to make informed trades. 25/n 2.6K views · 4 likes · 0 reposts · 0 replies Open on X →
In summary, there are many technical indicators used by traders in Indian stock markets. By understanding and using these indicators, traders can make more informed trading decisions and potentially increase their profitability. 24/n 2.7K views · 3 likes · 0 reposts · 1 replies Open on X →
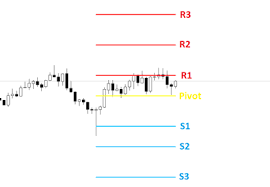
Traders use Pivot Points to identify potential buy and sell signals, as well as to set stop loss and take profit levels. 23/n 2.3K views · 3 likes · 1 reposts · 1 replies Open on X →
Pivot Points are a popular technical indicator used by traders in Indian stock markets. They are calculated based on the previous day's high, low, and closing price, and are used to identify potential support and resistance levels for the current trading day. 22/n https://t.co/
3.3K views · 3 likes · 1 reposts · 1 replies Open on X →
Traders use VWAP to identify potential buy and sell signals and to confirm the direction of the trend. 21/n 2.8K views · 3 likes · 1 reposts · 1 replies Open on X →
The VWAP is a popular technical indicator used by traders in Indian stock markets. It calculates the average price of a stock based on both the volume and the price, giving more weight to higher volume trades. 20/n https://t.co/82xQKvERKu
3K views · 6 likes · 1 reposts · 1 replies Open on X →
The Alligator Jawline is a technical indicator used by traders to identify the trend of a stock in Indian stock markets. It consists of three lines, with the blue line representing the Jawline, which is a 13-period Simple Moving Average (SMA) shifted 8 bars into the future. 19/n
3.5K views · 1 likes · 0 reposts · 1 replies Open on X →
The Super Trend is useful for traders who want to follow trends and stay in a trade for a longer duration. However, it's important to note that the Super Trend should not be used in isolation, and traders should use other indicators and techniques to confirm their trades. 18/n 2.6K views · 2 likes · 1 reposts · 1 replies Open on X →
The Super Trend indicator plots two lines on the chart: the upper line represents resistance and the lower line represents support. Traders use the crossover of the price with these lines as potential buy or sell signals. 17/n 2.2K views · 2 likes · 0 reposts · 1 replies Open on X →
The Super Trend indicator is another popular technical indicator used by traders in Indian stock markets. It is a trend following indicator that uses the moving average and the Average True Range (ATR) to identify the direction of the trend and potential reversal points. 16/n ht
2.4K views · 1 likes · 0 reposts · 1 replies Open on X →
Fibonacci retracements are not technically an indicator, but they are commonly used in Indian stock markets. These retracements use mathematical ratios to identify potential support and resistance levels in a stock's price movements. 15/n https://t.co/cqxPwxg4BS
3K views · 5 likes · 2 reposts · 1 replies Open on X →
Commodity Channel Index (CCI) is an oscillator that measures a stock's deviation from its average price. Traders use CCI to identify overbought or oversold conditions and potential buy and sell signals. 14/n https://t.co/qmYXlbblEf
3.9K views · 5 likes · 1 reposts · 1 replies Open on X →
Average Directional Index (ADX) is an indicator that measures the strength of a stock's trend. Traders use ADX to identify whether the trend is strong or weak, and to determine whether to enter or exit a trade. 13/n https://t.co/lNkOduJO3q
4.3K views · 4 likes · 1 reposts · 1 replies Open on X →
On Balance Volume (OBV) is an indicator that measures the volume of a stock's trades and uses it to predict price movements. Traders use OBV to confirm trends and to identify potential buy and sell signals. 12/n https://t.co/3vHiB3PW95
3.6K views · 2 likes · 3 reposts · 1 replies Open on X →
Stochastic Oscillator is an indicator that compares the closing price of a stock to its price range over a specific period of time. Traders use this indicator to identify overbought or oversold conditions in the stock's price movements. 11/n https://t.co/kbK6BRjSj3
3.2K views · 3 likes · 2 reposts · 1 replies Open on X →
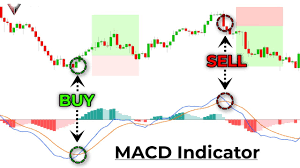
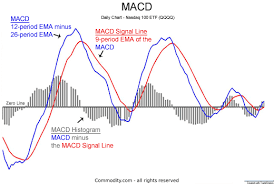
Moving Average Convergence Divergence (MACD) is an indicator that shows the relationship between two moving averages of a stock's price. Traders use MACD to identify changes in momentum and potential buy and sell signals. 10/n https://t.co/a3VAKhKcre
3.4K views · 5 likes · 1 reposts · 1 replies Open on X →
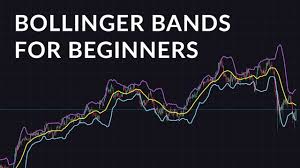
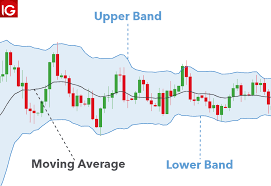
Bollinger Bands is another popular indicator used in Indian stock markets. It consists of a moving average and two bands that are plotted above and below the moving average. Traders use Bollinger Bands to determine whether the stock is overbought or oversold. 9/n https://t.co/iq
3.3K views · 1 likes · 0 reposts · 1 replies Open on X →
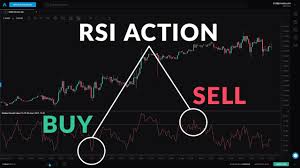
Conversely, when the RSI is below 30, the asset is considered oversold, indicating that it may be due for a price increase. Traders often use the RSI to confirm trends or identify potential trend reversals. 8/n 3.4K views · 2 likes · 0 reposts · 1 replies Open on X →
The RSI is typically displayed on a chart as a line that oscillates between 0 and 100. When the RSI is above 70, the asset is considered to be overbought, indicating that it may be due for a price correction. 7/n 3.3K views · 3 likes · 0 reposts · 1 replies Open on X →
Another commonly used indicator is the Relative Strength Index (RSI). RSI measures the strength of a stock's price movement by comparing the average gains to the average losses over a specific period of time. 6/n https://t.co/3VOlm55IwF
3.5K views · 4 likes · 0 reposts · 1 replies Open on X →
and are more useful for identifying long-term trends.Moving averages can be used on their own or in combination with other technical indicators to create trading strategies. 5/n 3.5K views · 1 likes · 0 reposts · 1 replies Open on X →
By comparing the current price of an asset to its moving average, traders can determine whether the price is trending up, down, or moving sideways.Short-term moving averages respond more quickly to price changes, while longer-term moving averages provide a smoother trendline. 4/n 3.6K views · 2 likes · 0 reposts · 1 replies Open on X →
One of the most popular indicators used in Indian stock markets is the Moving Average (MA). This indicator calculates the average price of a stock over a specific time period, such as 20 days or 50 days. Traders use MA to identify trends in the stock's price movements. 3/n https
4.4K views · 5 likes · 1 reposts · 1 replies Open on X →
If you're interested in trading in Indian stock markets, understanding technical indicators is essential. Technical indicators are tools used by traders to analyze the price movements of stocks and to predict future price movements. 2/n 5.6K views · 5 likes · 0 reposts · 1 replies Open on X →

Dibandingkan akun berukuran sama

5 postingan dari 90 hari terakhir, dibandingkan dengan rentang 10K–100K pengikut. jangkauan biasa untuk ukurannya, reaksi lebih lemah dari kebanyakan.

Median tayangan2 797akun ini936median untuk 10K–100K
Jangkauan, %3.67%akun ini3.43%median untuk 10K–100K
Interaksi, %0.16%akun ini1.55%median untuk 10K–100K
MetrikAkun iniMedian untuk 10K–100KRasio
Median tayangan per postingan2 7979362.99×
Jangkauan (tayangan ÷ pengikut)3.67%3.43%1.07×
Tingkat interaksi0.16%1.55%0.10×

Akun lain pada rentang ini →   Bandingkan dengan akun lain →   Bagaimana tolok ukur ini disusun →

Growth & engagement

How the posts we collected actually performed: views and reaction rate post by post, what the audience did with them, and where the follower count goes.

Views per post

2.6K27 Feb
3.5K
3K
2.8K
3.3K
2.3K
2.7K
2.6K
220
2.9K13 Aug
2.5K8 Sep
3.2K17 Sep
391
2.8K18 Sep

Last 14 collected posts, oldest on the left. The scale is logarithmic: one post can outrun the rest a hundred times over.

Engagement rate per post

0.15%27 Feb
0.06%
0.26%
0.18%
0.15%
0.22%
0.15%
0.15%
0.91%
0.07%13 Aug
0.16%8 Sep
0.37%17 Sep
0.00%
0.21%18 Sep

Reactions — likes, reposts, replies and quotes — divided by views. Median for 10K–100K accounts is 1.55%.

What the audience does

Likes53.8%91 in total
Reposts10.1%17 in total
Replies18.3%31 in total
Quotes0.6%1 in total
Bookmarks17.2%29 in total

Share of every reaction we collected for this account. Replies mean argument, reposts mean endorsement, bookmarks mean the post was worth keeping.

The follower curve appears once this account has two daily snapshots — we take one a day, and this one is on its first.

Akun serupa