
Brian Feroldi ✓
@BrianFeroldi · Try If Free ➜ · joined 30 Jul 2009
🔎 I Teach Investors How To Analyze Businesses | Author & Financial Educator | 20+ Years Investing Experience | Building Stock Simplifier ⬇️
Ultimi post


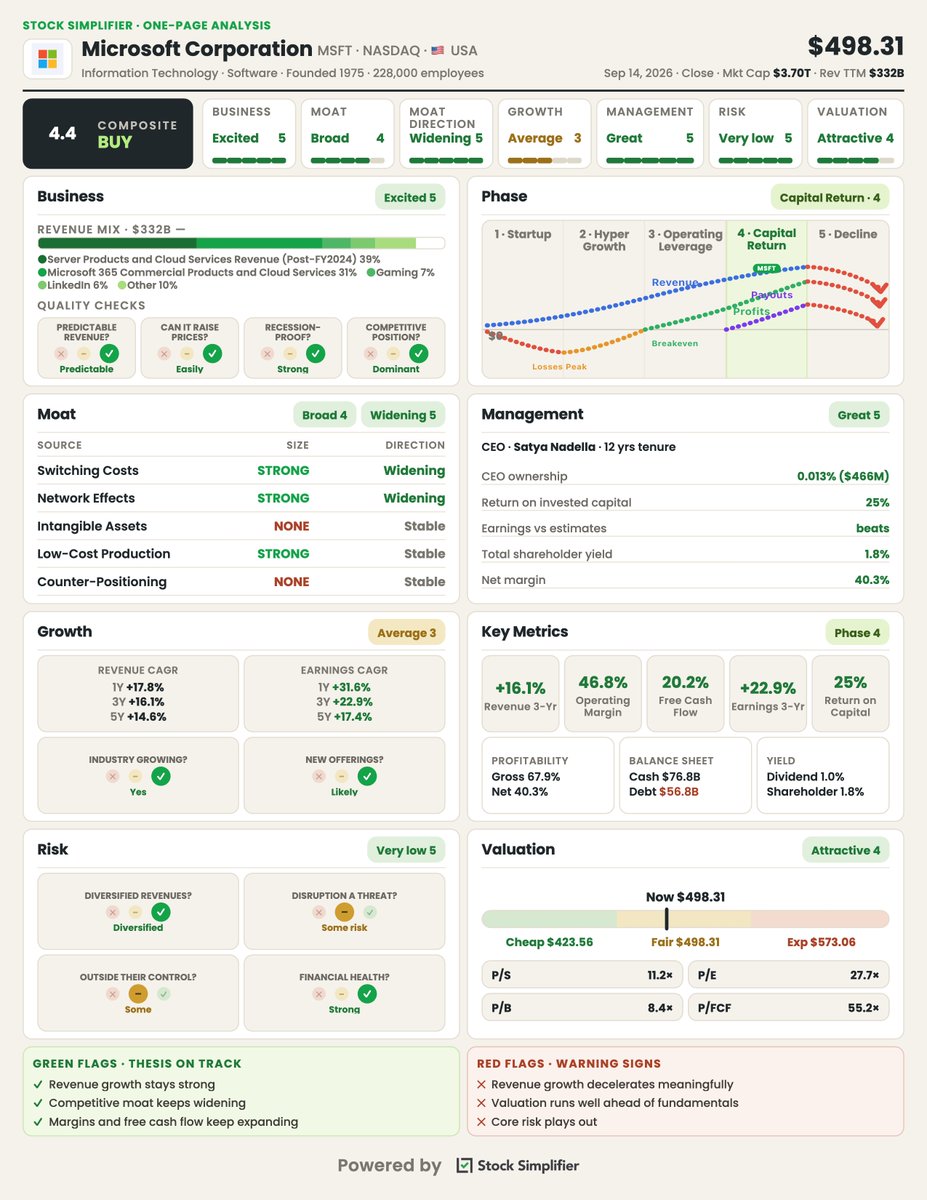

Rispetto ad account della stessa dimensione
6 post degli ultimi 90 giorni, accanto alla fascia di 100K–1M follower. arriva a molti, ma pochi di loro reagiscono.
| Metrica | Questo account | Mediana per 100K–1M | Rapporto |
|---|---|---|---|
| Visualizzazioni mediane per post | 16 861 | 5 983 | 2.82× |
| Copertura (visualizzazioni ÷ follower) | 2.51% | 1.49% | 1.68× |
| Tasso di interazione | 0.67% | 0.93% | 0.73× |
Altri account di questa fascia → Confronta con un altro account → Come sono costruiti questi parametri →
Growth & engagement
How the posts we collected actually performed: views and reaction rate post by post, what the audience did with them, and where the follower count goes.
Views per post
Last 6 collected posts, oldest on the left. The scale is logarithmic: one post can outrun the rest a hundred times over.
Engagement rate per post
Reactions — likes, reposts, replies and quotes — divided by views. Median for 100K–1M accounts is 0.93%.
What the audience does
Share of every reaction we collected for this account. Replies mean argument, reposts mean endorsement, bookmarks mean the post was worth keeping.
The follower curve appears once this account has two daily snapshots — we take one a day, and this one is on its first.
Account simili
 Dr Mahathir Mohamad ✓
@chedetofficial
1.3M followers
· 10.7K posts
 𝗝 𝗘 𝗙 𝗙 𝗦 𝗔 𝗧 𝗨 𝗥 (罗杰夫) ✓
@jeffsatur
1.3M followers
· 2.8K posts
 Shirley Setia ✓
@ShirleySetia
1.3M followers
· 12.7K posts
 Sun Music ✓
@SunMusic
1.3M followers
· 23.5K posts
 Breaking Bad ✓
@BreakingBad
1.3M followers
· 5.5K posts
 Infobae América ✓
@infobaeamerica
1.3M followers
· 907.9K posts
 Brock Lesnar ✓
@BrockLesnar
1.3M followers
· 180 posts
 Don Jaga 👽 ✓
@ELgh_
1.3M followers
· 57.9K posts