tweetindex
IT

NASA Earth ✓

@NASAEarth · Earth · joined 17 Mar 2009

NASA’s favorite (habitable) planet. 🌎💚 Studying Earth from ground to orbit.

3 725 627Followers
86Following
24 995Posts total
11.7MViews on collected posts

Ultimi post

For the first time in nearly five centuries, Krasheninnikov erupted. 🌋 The @NASA/@ISRO NISAR satellite captured lava filling its caldera and overflowing into a wider crater, showing how NISAR can repeatedly monitor volcanoes and other natural hazards in sharp detail. https://t.c
0:16
59.9K views · 485 likes · 97 reposts · 11 replies Open on X →
Arctic sea ice reached its yearly minimum extent on Sept. 12, 2026, @NASA and @NSIDC report. The ice covered 1.78 million square miles, making it the 10th-lowest in the satellite record, tied with 2008, 2010, and 2025. https://t.co/RGqNQjD5hJ https://t.co/r0br8gZQ6K
0:26
138K views · 1.5K likes · 369 reposts · 55 replies Open on X →
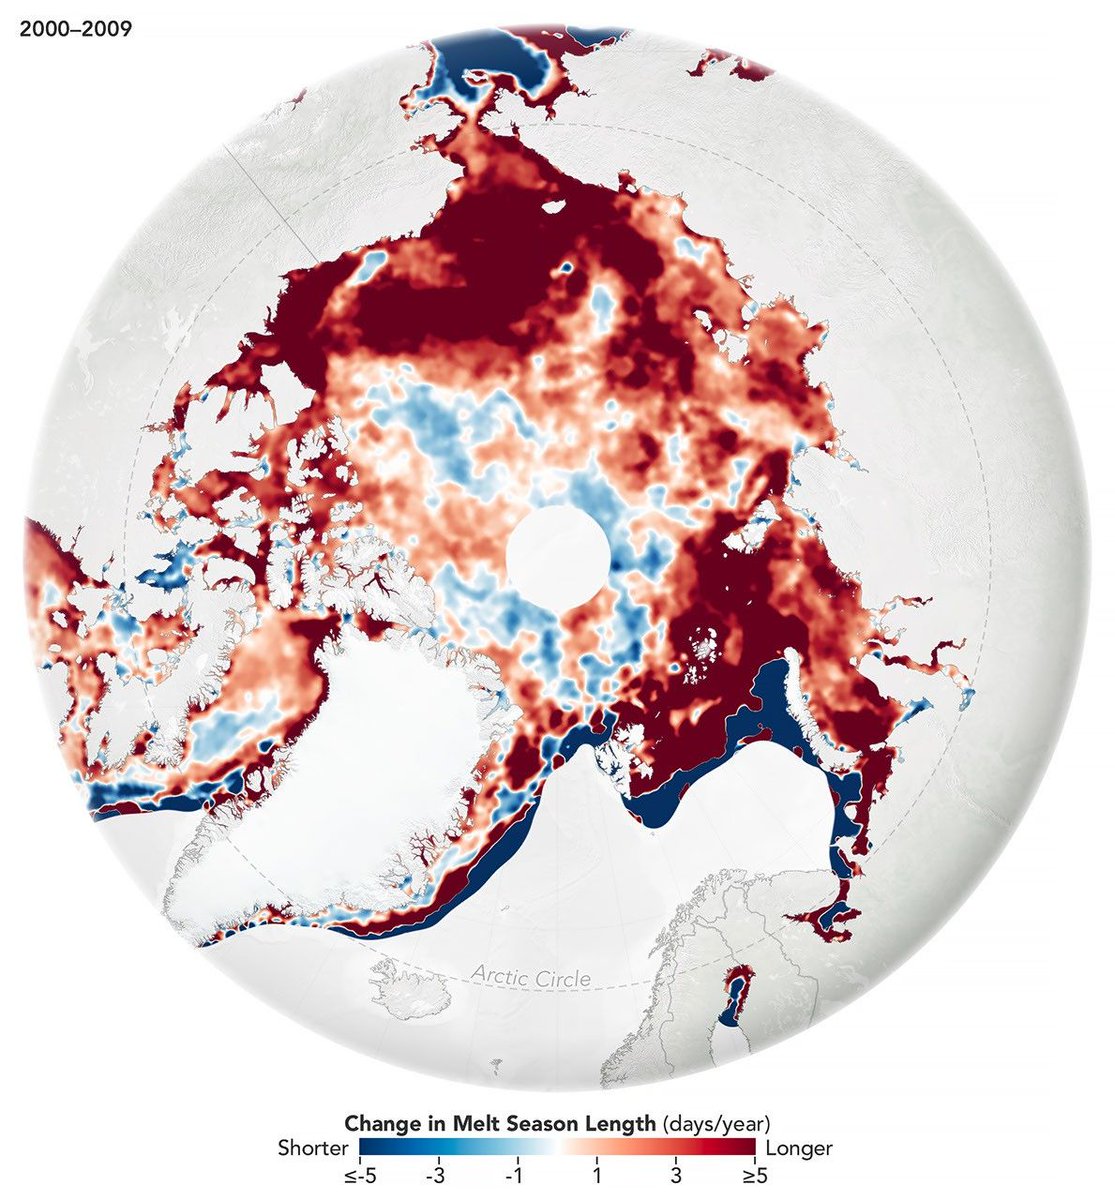
The melting season for Arctic sea ice is about 40 days longer than in 1979. Much of that change happened prior to 2010, when the season length stabilized. The findings come from a @NASA-led study of satellite observations of Arctic sea ice from 1979-2023. https://t.co/AwBXxt9G1J
Map of the Arctic with colors indicating how the sea ice melting season has changed from 2000 to 2009. Red indicates areas where the season grew longer. Blue indicates where it grew shorter. The map is mostly dark red, indicating an increase of about 5 days or more. Closer to the pole, the melting season has changed less dramatically. Credit: NASA
Map of the Arctic with colors indicating how the sea ice melting season has changed from 2010 to 2023. Red indicates areas where the season grew longer. Blue indicates where it grew shorter. The map shows a mix of lighter red and blue, indicating smaller changes of only a few days. Credit: NASA
54.3K views · 508 likes · 118 reposts · 12 replies Open on X →
The second-largest reservoir in the U.S. has dropped to record-low water levels. These satellite images show Colorado’s Lake Powell in 2017, when water levels were high, and now in 2026, when snow drought and unusually warm temperatures have driven water levels to record lows. h
GIF
2M views · 2.4K likes · 537 reposts · 168 replies Open on X →
It’s the last week of summer in the Northern Hemisphere, but the season is going out with record-breaking heat. 🥵 A heat dome sent temperatures soaring in the south-central U.S. on Sept. 15, 2026. This map shows air temperatures from satellites and @NASAGoddard’s GEOS model. ht
Map of air temperatures in the contiguous United States during a heat dome on September 15, 2026. White and light blue colors indicate cooler temperatures below 20 degrees Celsius. Oranges and reds indicate warmer temperatures around 25 to 45 degrees Celsius. The darkest reds indicate temperatures at or above 45 degrees Celsius. Much of the south, central, and eastern U.S. are some shade of orange or red. Darker reds cover Texas and several states to the east and northeast. Credit: NASA
68.9K views · 664 likes · 176 reposts · 42 replies Open on X →
If Earth were a hard marble, its center of mass would stay in the middle – but in reality, the center shifts as seasons move water, ice, and air around the planet. NASA scientists developed a new way to track these motions more precisely, helping improve mapping and navigation. h
A 3D digital illustration of Earth with a slice cut away to reveal its internal layers. The exterior shows a realistic view of the globe, focusing on Europe, Asia, and Africa with visible geographic features and grid lines. Credit: NASA’s Scientific Visualization Studio
51.5K views · 531 likes · 79 reposts · 20 replies Open on X →
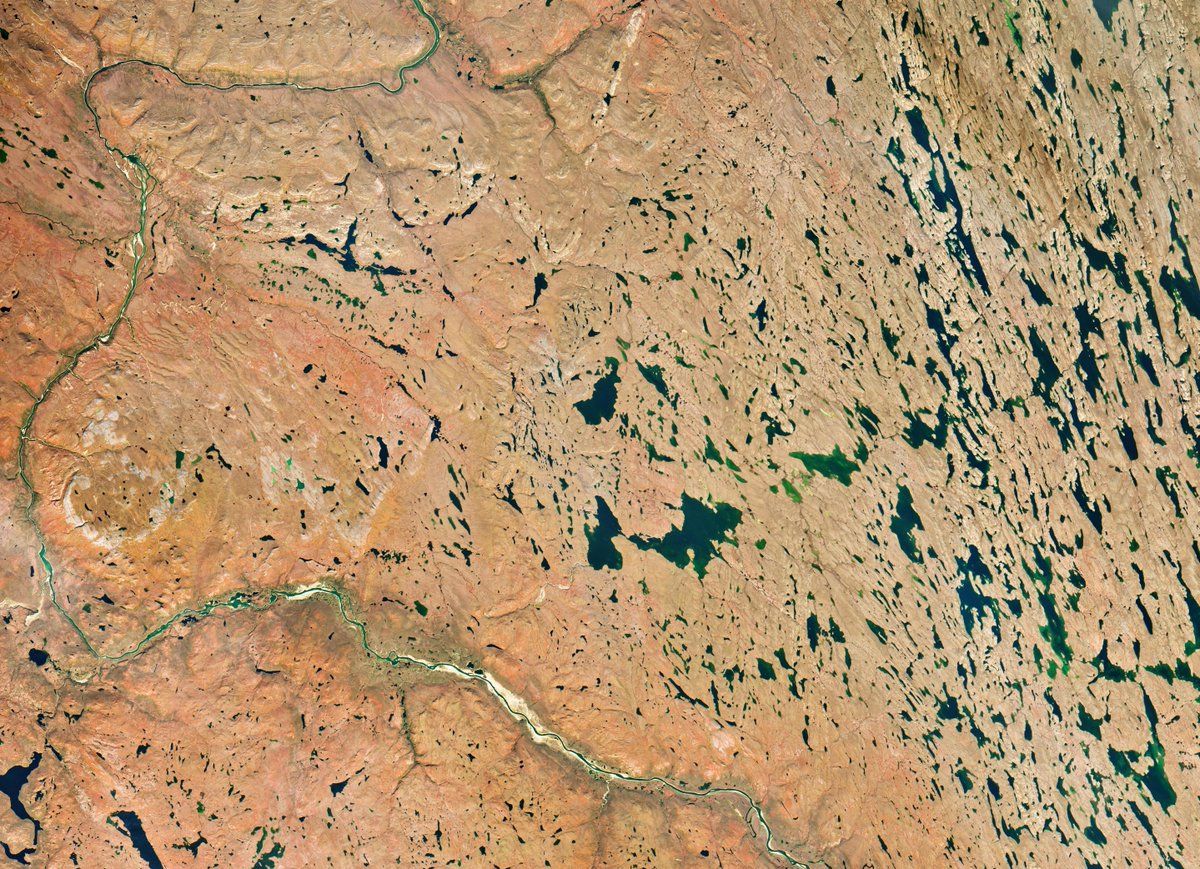
Fall vibes come early in the far north 🍂 The low-growing shrubs in this area reach peak red, orange, and yellow in mid-September, finds a @NASA and @SDState analysis of satellite data. But blink and you might miss it! Peak color can last a week or less in the far north. https:/
Satellite image of Nunavut, Canada on September 6, 2026. Much of the image is pale orange and yellow as the leaves change to fall colors. The Coppermine River winds across the left and bottom sides of the image. Blue and green lakes and ponds dot the landscape. Credit: NASA
31.8K views · 217 likes · 27 reposts · 11 replies Open on X →
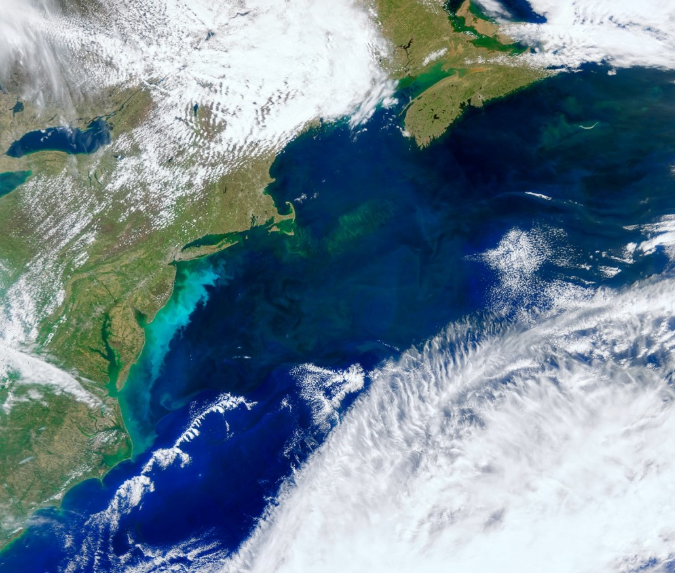
The ocean has a hidden garden of phytoplankton. You just need to know how to see it, and NASA’s PACE mission has the tools! 🌊🛰️ With PACE, scientists can identify types of phytoplankton in the water, which each play a different role in ocean ecosystems. https://t.co/6f95yFH9E1
True color satellite image showing a phytoplankton bloom off the U.S. East Coast in May 2024. The bloom looks like a milky, bright blue swirl just off the coast. Credit: NASA
38.9K views · 437 likes · 75 reposts · 19 replies Open on X →
How will El Niño affect hurricanes? NASA satellites are helping improve predictions. 🌀 NASA and European Sentinel-6 satellites measure sea level height to track changes in ocean heat and better understand shifts in hurricane patterns. The data can help guide disaster response. h
Hurricane Melissa as seen from the International Space Station on Oct. 28, 2025. Thick white clouds spiral out from the storm's eye 50 miles south of Jamaica. A panel of the ISS cuts in on the left. Credit: NASA
46.3K views · 384 likes · 69 reposts · 9 replies Open on X →
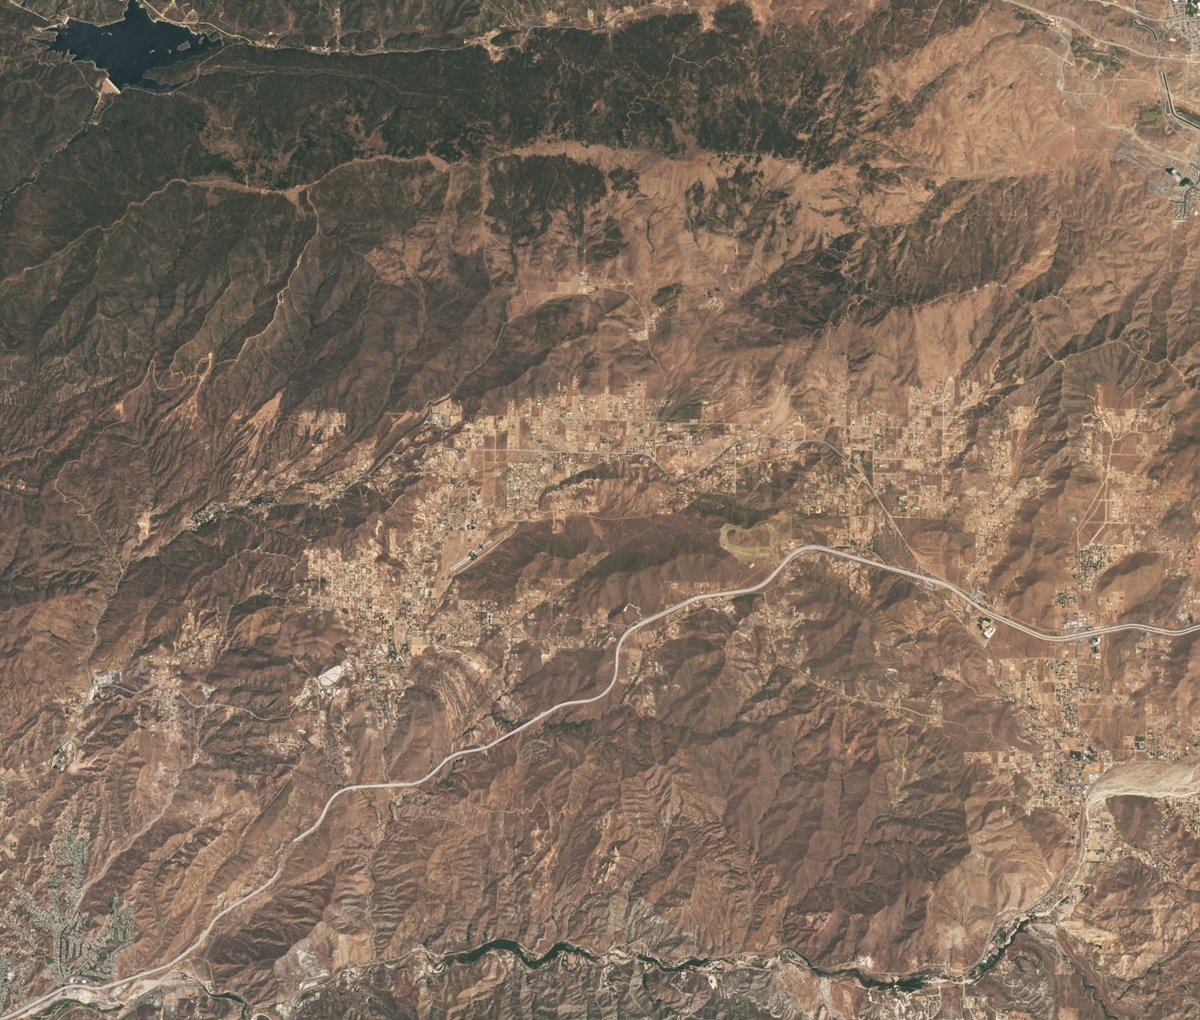
Do you recognize this area? If so, you might be a Star Trek fan! 🖖 This @NASA satellite image shows Vasquez Rocks Natural Area in Southern California. Multiple Star Trek scenes were filmed here, including an iconic battle between Captain James T. Kirk and a reptilian alien. http
Natural color satellite image showing the Vasquez Rocks Natural Area and surrounding area in Southern California. Most of the landscape is brown and mountainous.The Vasquez Rocks appear as a patch of curved gray stripes just below and to the left of center near Agua Dulce. Palmdale is barely visible in the top right corner and the Bouquet Reservoir is near the top left corner. Credit: NASA
50.4K views · 368 likes · 55 reposts · 13 replies Open on X →
NASA studies air pollution around the world to better understand what’s in the air and what it can mean for human health. #CleanAirDay 57.6K views · 127 likes · 21 reposts · 3 replies Open on X →
@NASAEarth @NASA https://t.co/iNYMT4cMkb 698 views · 2 likes · 0 reposts · 0 replies Open on X →
@NASAEarth @NASA Interesting view of Earth from Aqua. Here’s another data-driven take: statistical processing of a long rotating-Earth video (average, max, min, std. deviation) that turns our planet into four different-looking worlds. https://t.co/RV68LE9poK 1.7K views · 2 likes · 0 reposts · 0 replies Open on X →
Four “planets” from one Earth 🌍 I took a long NASA video of the rotating Earth and computed four statistical views: • Average • Maximum • Minimum • Standard deviation #Earth #DataVisualization #NASA #CitizenScience #ExperimentalPhotography https://t.co/esZ1i1tMXJ 2.6K views · 2 likes · 1 reposts · 1 replies Open on X →
@NASAEarth @NASA Garis keras panggil anabul oren raksasa buat jadi satpam air purifier raksasa di tengah kabut asap karhutla! 😭 Asli, paru-paru warga udah gak kuat spoiler asap mulu tiap taun. Plis ini solusinya gimana bestie? 💀🌿 #KabutAsap #Karhutla #PolusiUdara ​#KabutAsap ​#Po 3.2K views · 0 likes · 0 reposts · 0 replies Open on X →
@NASAEarth CALLING FOR HELP! PLEASE, PLEASE, PLEASE... PLEASE HELP US IN INDONESIA. BECAUSE OUR OWN GOVERNMENT DO NOTHING ABOUT THIS! FOR THE SAKE OF POWERLESS PEOPLE, FOR THE SAKE OF BIODOVERSITIES IN THE "LUNG OF THE WORLD" FOR THE SAKE OF THE RIGHT TO BREATHE CLEAN AIR 😥😥 97.6K views · 5.8K likes · 513 reposts · 4 replies Open on X →
@NASAEarth @logos_id I believe that It’s a human made, they were trying to clear lands to replace the forest with palm trees for profit, sacrificing all wildlife plants and animals living there for greed, the big corps and the government worked together, sad 88.8K views · 4.1K likes · 360 reposts · 12 replies Open on X →
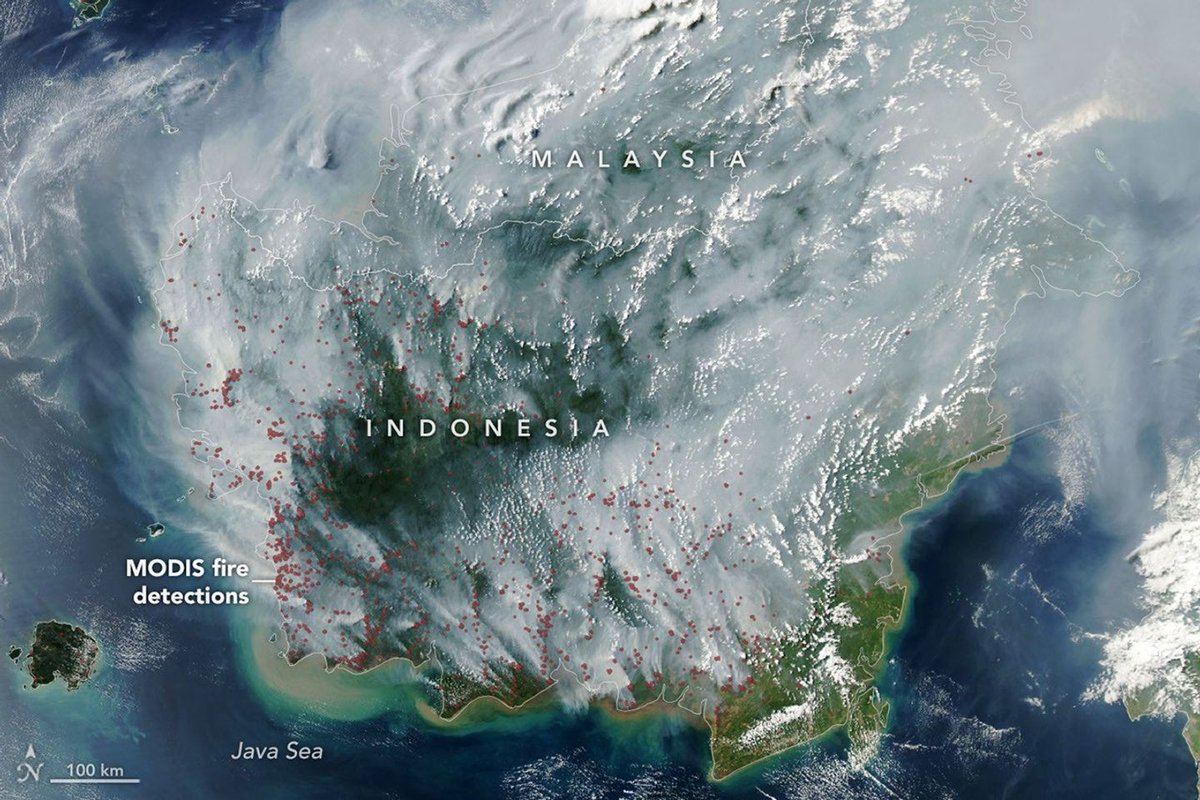
This image from @NASA’s Aqua satellite shows smoke covering much of Indonesia and Malaysia on September 1, 2026. Red dots have been added where the satellite’s MODIS instrument detected thermal anomalies indicative of fire. https://t.co/BTsczWwoxL 210K views · 2.3K likes · 686 reposts · 5 replies Open on X →
Fires are smoldering in Indonesia, which is in a severe and widespread drought. Some of these are tropical peatland fires, which burn slowly, release higher amounts of air pollution, and are notoriously difficult to extinguish. https://t.co/gulsKrmSMR
NASA satellite image of fire smoke covering much of Indonesia and Malaysia on September 1, 2026. The plumes are gray, with only some areas of green and brown land visible through the smoke. Red dots have been added to show where the MODIS instrument detected fires. The dots are primarily on the western and southern parts of Indonesia and often cluster together. Credit: NASA
4.2M views · 82.8K likes · 57K reposts · 1.1K replies Open on X →
Update: The Artemis II crew were 252,756 miles from Earth at the farthest point in their trajectory. 60.5K views · 936 likes · 116 reposts · 10 replies Open on X →
@NASAEarth Bringing @rookisaacman on as NASA administrator is truly one of the best moves President Trump has made in his adminstration. The amount of pride you hear from every day Americans about NASA and Artemis is absolutely inspirational. Has done wonders for patriotism. 🇺🇸 10.3K views · 805 likes · 57 reposts · 10 replies Open on X →
New record🥇 The Artemis II astronauts are now farther from Earth than humans have ever been! At 1:57 p.m. EDT, they broke the record set by Apollo 13 in 1970. Their journey around the far side of the Moon today will take them a maximum distance of 252,752 miles from Earth. ht
0:41
4.4M views · 54.6K likes · 9.7K reposts · 534 replies Open on X →
Clean air matters for everyone. 🌎 With missions like TEMPO, NASA helps track air quality across North America, helping communities plan for a healthier future. #CleanAirDay Learn more: https://t.co/qVKcLgbdDF https://t.co/9M7fGrCmXc
2:18
82.1K views · 180 likes · 50 reposts · 15 replies Open on X →

Rispetto ad account della stessa dimensione

19 post degli ultimi 90 giorni, accanto alla fascia di 1M–10M follower. arriva ben oltre il proprio pubblico, e quel pubblico reagisce.

Visualizzazioni mediane54 335questo account14 648mediana per 1M–10M
Copertura, %1.46%questo account0.74%mediana per 1M–10M
Interazione, %1.01%questo account0.70%mediana per 1M–10M
MetricaQuesto accountMediana per 1M–10MRapporto
Visualizzazioni mediane per post54 33514 6483.71×
Copertura (visualizzazioni ÷ follower)1.46%0.74%1.97×
Tasso di interazione1.01%0.70%1.45×

Altri account di questa fascia →   Confronta con un altro account →   Come sono costruiti questi parametri →

Growth & engagement

How the posts we collected actually performed: views and reaction rate post by post, what the audience did with them, and where the follower count goes.

Views per post

2.6K4 Sep
1.7K
698
57.6K8 Sep
50.4K
46.3K9 Sep
38.9K10 Sep
31.8K14 Sep
51.5K16 Sep
68.9K17 Sep
2M18 Sep
54.3K21 Sep
138K23 Sep
59.9K24 Sep

Last 14 collected posts, oldest on the left. The scale is logarithmic: one post can outrun the rest a hundred times over.

Engagement rate per post

0.19%4 Sep
0.12%
0.29%
0.26%8 Sep
0.87%
1.00%9 Sep
1.37%10 Sep
0.81%14 Sep
1.23%16 Sep
1.30%17 Sep
0.16%18 Sep
1.18%21 Sep
1.39%23 Sep
1.01%24 Sep

Reactions — likes, reposts, replies and quotes — divided by views. Median for 1M–10M accounts is 0.70%.

What the audience does

Likes65.3%159 196 in total
Reposts28.8%70 165 in total
Replies0.9%2 100 in total
Quotes2.3%5 550 in total
Bookmarks2.8%6 718 in total

Share of every reaction we collected for this account. Replies mean argument, reposts mean endorsement, bookmarks mean the post was worth keeping.

Followers by day

21 Sep24 Sep

Daily snapshots since 21 Sep 2026; the dashed line is the starting count.

Account simili