tweetindex
IT

Yadnya Investment Academy

@investyadnya · India · joined 15 Feb 2016

Unbiased | Transparent | Simple | Honest Financial Advise & Research | SEBI Regd.

28 541Followers
8Following
13 841Posts total
6.1KViews on collected posts

Ultimi post

Indian defense is moving several steps ahead of traditional manufacturing. It’s not reliant on imports anymore. India is now building a multi-billion-dollar indigenous defense superpower through 8 key stocks. HAL, BDL, MDL, BEL, Solar Industries, Astra Microwave, Data https://
51:20
505 views · 2 likes · 1 reposts · 0 replies Open on X →
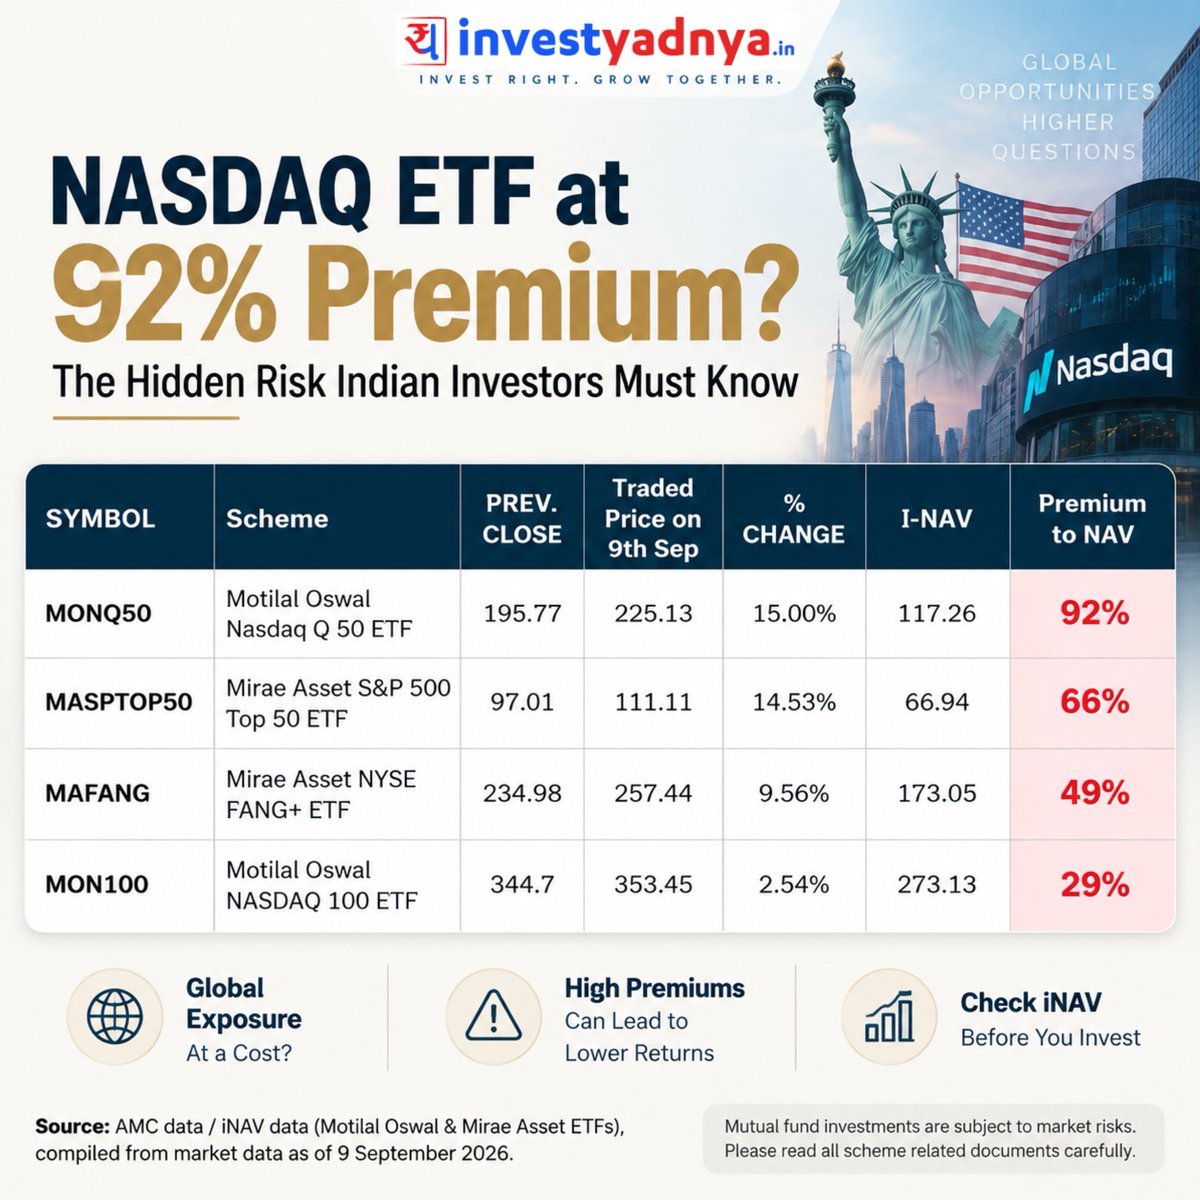
Market price ≠ Actual value Always check iNAV, liquidity, and premium/discount before investing. https://t.co/8Q5vIS9rNk
International investing has become popular among Indian investors, but there is one important factor many overlook — the price you pay versus the actual value of the ETF.

Some India-listed US ETFs have recently traded at significant premiums to their iNAV:

📌 Motilal Oswal Nasdaq Q 50 ETF — 92% Premium
📌 Mirae Asset S&P 500 Top 50 ETF — 66% Premium
📌 Mirae Asset NYSE FANG+ ETF — 49% Premium
📌 Motilal Oswal NASDAQ 100 ETF — 29% Premium

A higher market price does not always mean higher value.

Before investing in international ETFs, investors should understand:
• Difference between ETF market price and iNAV
• Liquidity challenges in global ETFs
• Impact of buying at a premium on future returns

Global diversification can be valuable, but valuation discipline matters everywhere — even in ETFs.

Source: AMC data / iNAV data (Motilal Oswal & Mirae Asset ETFs), compiled from market data as of 9 September 2026.
458 views · 0 likes · 0 reposts · 0 replies Open on X →
The World Is Changing Its Rate Cycle. Should Your Investment Strategy Change Too? https://t.co/pkcNPyr2yB 614 views · 2 likes · 0 reposts · 0 replies Open on X →
The market has a lot more to watch than just the Nifty today. From rising global bond yields and oil-market risks to the NSE IPO and the Tata Sons boardroom dispute — here are the key developments investors should know. Global Markets • US 10Y yield moves back above 5% as 744 views · 4 likes · 0 reposts · 0 replies Open on X →
Don't just copy mutual fund buys—understand why allocations are changing before your next trade! 1.2K views · 6 likes · 0 reposts · 0 replies Open on X →
https://t.co/XDysdK272c
167 views · 0 likes · 0 reposts · 0 replies Open on X →
https://t.co/Y5jWTMSVYt
221 views · 0 likes · 0 reposts · 1 replies Open on X →
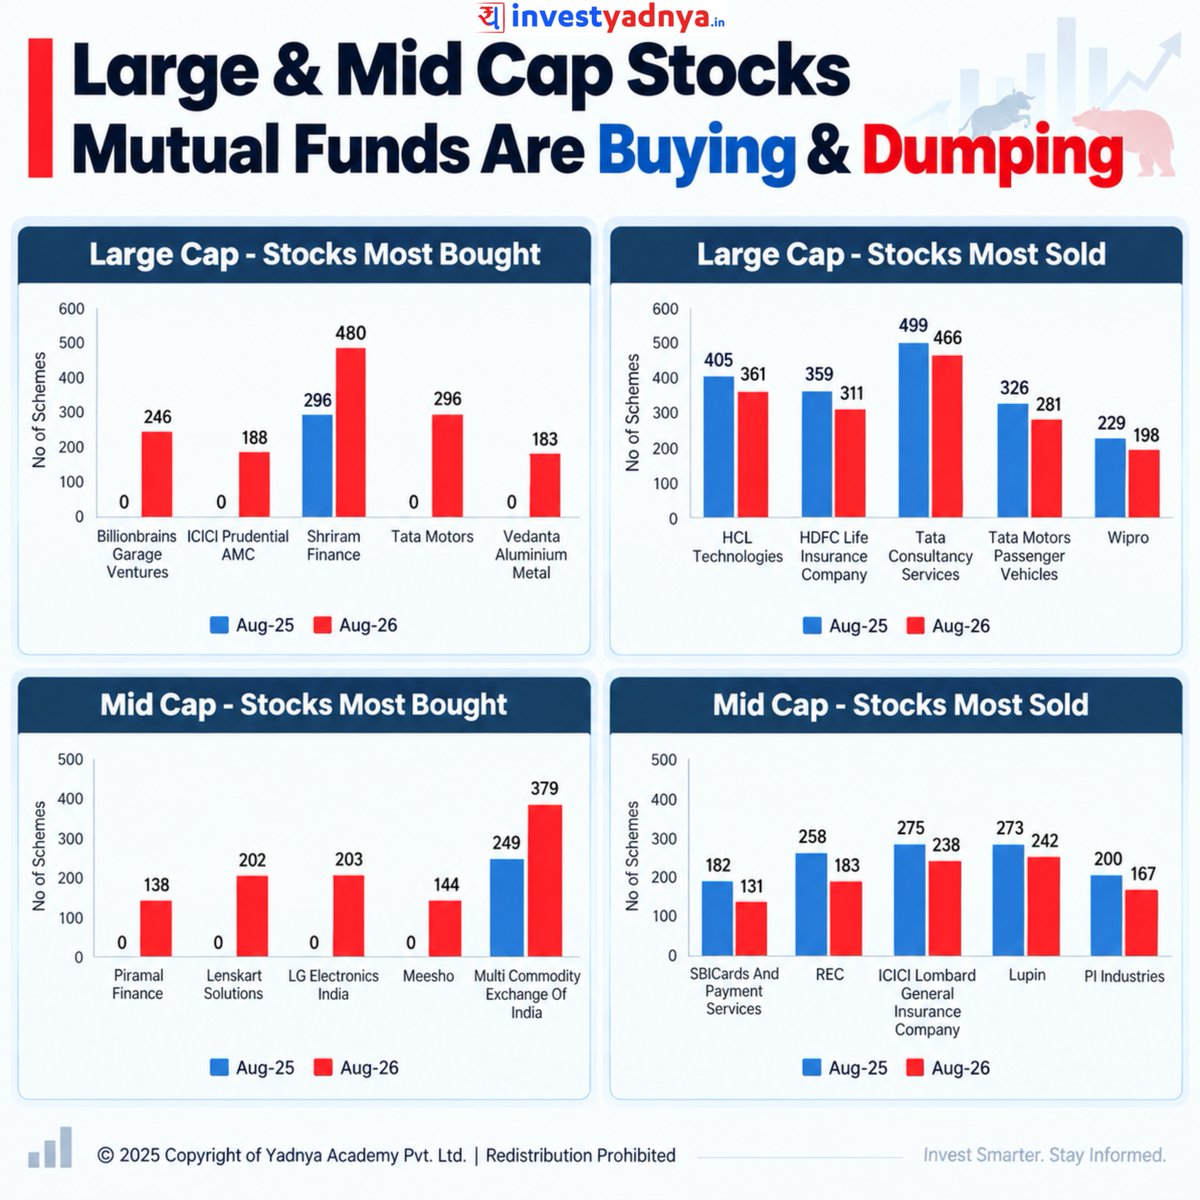
Fund managers are making major sector moves—see where big money is flowing before you make your next trade! Build a stronger, research-backed portfolio with 60% OFF our Model Portfolio. Claim your discount now: https://t.co/zW4gSuXHhd https://t.co/aikxoUKpnI
Where is mutual fund money moving in 2026?

From sector allocation to individual stock ownership, the latest mutual fund portfolio data shows some interesting shifts.

Financials continue to dominate sector allocations, but weights across Technology, Auto, FMCG, Healthcare, Energy and Services are changing.

At the stock level, mutual funds are also adding exposure to some large-cap, mid-cap and small-cap names while reducing participation in others.

The key takeaway?

Don’t simply copy what mutual funds are buying. Study why the allocation is changing.

A rise in the number of schemes holding a stock can reflect improving fundamentals, better valuations, index changes or a new investment opportunity.

Similarly, selling may happen because of valuations, portfolio rebalancing or deteriorating business expectations.

Use fund activity as a research signal — not an investment recommendation.

Swipe through and tell us:

Monthly Mutual Fund Portfolio Disclosures | Yadnya Research
2.2K views · 9 likes · 0 reposts · 1 replies Open on X →

Rispetto ad account della stessa dimensione

8 post degli ultimi 90 giorni, accanto alla fascia di 10K–100K follower. sotto i pari sia per copertura sia per interazione.

Visualizzazioni mediane560questo account987mediana per 10K–100K
Copertura, %1.96%questo account3.79%mediana per 10K–100K
Interazione, %0.48%questo account1.52%mediana per 10K–100K
MetricaQuesto accountMediana per 10K–100KRapporto
Visualizzazioni mediane per post5609870.57×
Copertura (visualizzazioni ÷ follower)1.96%3.79%0.52×
Tasso di interazione0.48%1.52%0.31×

Altri account di questa fascia →   Confronta con un altro account →   Come sono costruiti questi parametri →

Growth & engagement

How the posts we collected actually performed: views and reaction rate post by post, what the audience did with them, and where the follower count goes.

Views per post

2.2K18 Sep
221
167
1.2K
74421 Sep
614
458
505

Last 8 collected posts, oldest on the left. The scale is logarithmic: one post can outrun the rest a hundred times over.

Engagement rate per post

0.50%18 Sep
0.45%
0.00%
0.51%
0.54%21 Sep
0.33%
0.00%
0.59%

Reactions — likes, reposts, replies and quotes — divided by views. Median for 10K–100K accounts is 1.52%.

What the audience does

Likes74.2%23 in total
Reposts3.2%1 in total
Replies6.5%2 in total
Quotes3.2%1 in total
Bookmarks12.9%4 in total

Share of every reaction we collected for this account. Replies mean argument, reposts mean endorsement, bookmarks mean the post was worth keeping.

The follower curve appears once this account has two daily snapshots — we take one a day, and this one is on its first.

Account simili