tweetindex
IT

Nielsen ✓

@nielsen · Global 🌎 · joined 26 Aug 2008

Powering a better media future for all people.

182 006Followers
1 405Following
23 698Posts total
17.9KViews on collected posts

Ultimi post

Survivor is back! 🏝️ As season 51 kicks off, millions of fans are still enjoying the previous seasons with fans viewed over 556.7 million hours this year. What is your favorite Survivor moment? 🤔 https://t.co/jmk1wZwxTS
0:19
1.4K views · 0 likes · 0 reposts · 1 replies Open on X →
Two ways to show up. One growing audience 🗣️ Podcasts: 20% of daily ad-supported audio time among U.S. adults. 90% listen. 62% watch. 69% do both. Sports podcasts have the tightest crossover of any genre: 77%. Show up for both. https://t.co/2x4flKk3JT https://t.co/MKDehEJrCW
1.4K views · 0 likes · 0 reposts · 0 replies Open on X →
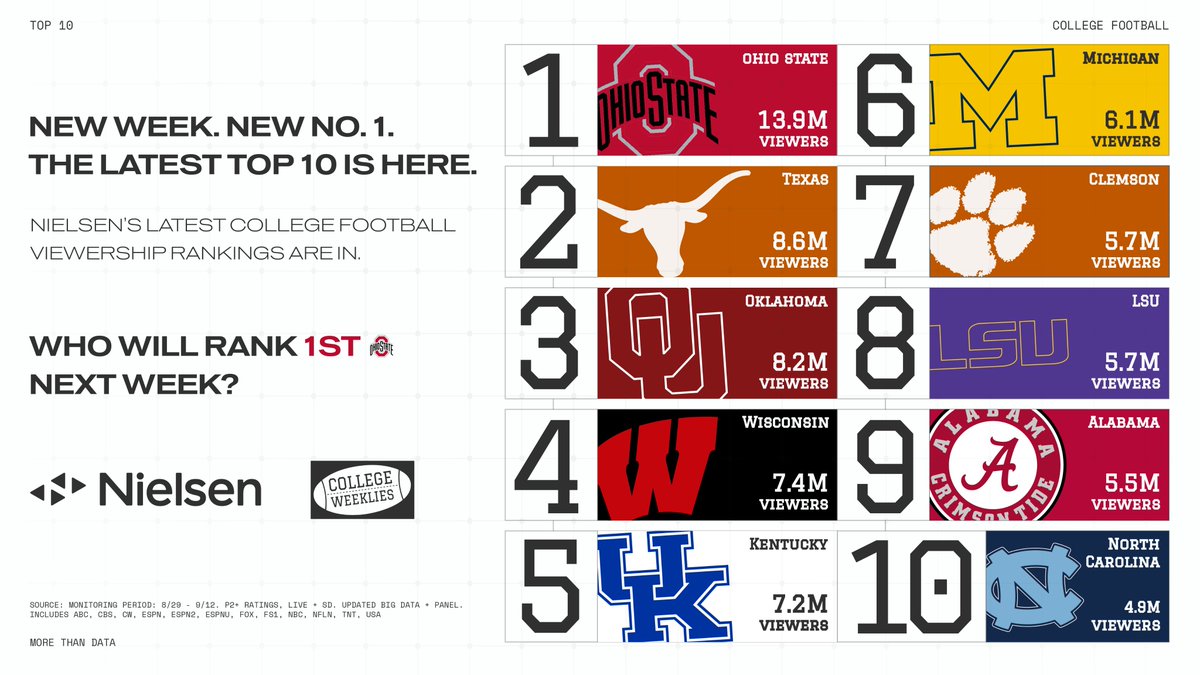
Ohio State’s college football viewership nearly doubled the #2 team this week 🏈 1️⃣ @OhioStateFB – 13.9M viewers 2️⃣ @TexasFootball – 8.6M viewers 3️⃣ @OU_Football - 8.2M viewers Did your team crack the top 10 most watched this week? 👀 https://t.co/icCZMed1EA
2.2K views · 2 likes · 2 reposts · 0 replies Open on X →
Step into the Nielsen Media Intelligence Lab. The journey begins when you reveal the records behind every major moment in streaming and broadcast history. Decades of data that decodes human behavior. Learn more: https://t.co/dvsDSB01Fq #Nielsen #MediaIntelligence #NYC https://
1.1K views · 0 likes · 0 reposts · 0 replies Open on X →
On August 27th, @RockstarGames partnered with @Netflix to debut a 27-minute extended look gameplay trailer for Grand Theft Auto VI and the data changed the game… 🎮 61.8M minutes viewed. One trailer. Zero competition. 146% more than the next nearest Netflix show… in just 26 ht
0:31
4.9K views · 11 likes · 4 reposts · 0 replies Open on X →
2026: The year hispanic talent took over America’s main stages 🎤🇺🇸 A thread on how Hispanic audiences set the pace for American culture this year, backed by the data. 🧵 https://t.co/xMMg7rhryZ
1.7K views · 1 likes · 0 reposts · 1 replies Open on X →
CTV just got a whole lot more transparent in EMEA. A thread on Nielsen Ad Intel's expansion into France and Italy and why it matters for anyone planning across platforms. 🧵 https://t.co/PhNPrSKHia
1.5K views · 0 likes · 0 reposts · 1 replies Open on X →
The Emmys air Monday, September 14th. But the real ballot? Viewing hours. And the data's already in. 👉 See the full 78th Primetime Emmy Awards report: https://t.co/iFU26CuXgN #Nielsen #MediaIntelligence #NielsenInsights #Emmys #EmmyAwards #PrimetimeEmmys #Emmys2026n #78thEmmys 492 views · 2 likes · 0 reposts · 0 replies Open on X →
🎥 Heads of State topped the Movie category, edging out two Netflix titles. 460 views · 1 likes · 0 reposts · 1 replies Open on X →
🔁 The Beast in Me and Survivor both defended their titles, with Survivor hitting Season 50. 68 views · 0 likes · 0 reposts · 1 replies Open on X →
😂 Abbott Elementary defends its Comedy title with 181M viewing hours, fueled by ABC primetime plus a big lift from Hulu and Disney+. 145 views · 1 likes · 0 reposts · 1 replies Open on X →
🎬 HBO Max's The Pitt takes the Drama crown with nearly 400M viewing hours, a huge leap from 4th place last year. 222 views · 1 likes · 0 reposts · 1 replies Open on X →
Nominations tell you what’s in the running… viewing hours tell you what actually won the year 🏆 https://t.co/0bU0WFvRLe
2.4K views · 4 likes · 1 reposts · 1 replies Open on X →

Rispetto ad account della stessa dimensione

13 post degli ultimi 90 giorni, accanto alla fascia di 100K–1M follower. sotto i pari sia per copertura sia per interazione.

Visualizzazioni mediane1 362questo account5 983mediana per 100K–1M
Copertura, %0.75%questo account1.49%mediana per 100K–1M
Interazione, %0.25%questo account0.93%mediana per 100K–1M
MetricaQuesto accountMediana per 100K–1MRapporto
Visualizzazioni mediane per post1 3625 9830.23×
Copertura (visualizzazioni ÷ follower)0.75%1.49%0.50×
Tasso di interazione0.25%0.93%0.27×

Altri account di questa fascia →   Confronta con un altro account →   Come sono costruiti questi parametri →

Growth & engagement

How the posts we collected actually performed: views and reaction rate post by post, what the audience did with them, and where the follower count goes.

Views per post

2.4K13 Sep
222
145
68
460
492
1.5K14 Sep
1.7K
4.9K15 Sep
1.1K17 Sep
2.2K18 Sep
1.4K21 Sep
1.4K23 Sep

Last 13 collected posts, oldest on the left. The scale is logarithmic: one post can outrun the rest a hundred times over.

Engagement rate per post

0.25%13 Sep
0.90%
1.38%
1.47%
0.43%
0.41%
0.07%14 Sep
0.12%
0.35%15 Sep
0.00%17 Sep
0.18%18 Sep
0.00%21 Sep
0.07%23 Sep

Reactions — likes, reposts, replies and quotes — divided by views. Median for 100K–1M accounts is 0.93%.

What the audience does

Likes51.1%23 in total
Reposts15.6%7 in total
Replies17.8%8 in total
Quotes4.4%2 in total
Bookmarks11.1%5 in total

Share of every reaction we collected for this account. Replies mean argument, reposts mean endorsement, bookmarks mean the post was worth keeping.

The follower curve appears once this account has two daily snapshots — we take one a day, and this one is on its first.

Account simili

Frequently asked questions about @nielsen

How many followers does @nielsen have?

182 006 followers.

How many posts has @nielsen published?

23 698 posts.

How do posts by @nielsen perform?

Collected posts: 13. Views: 17 874. Likes: 23.