tweetindex
IT

Srinivas Alavilli ✓

@srinualavilli · Bengaluru · joined 30 Dec 2008

Opinions my own. FPTD@BKC @bkcmoves Fellow @WRIIndia; Ex Janaagraha/Oracle/Sun; @citizensforblr #SteelFlyoverBeda #ChukuBukuBeku #BusBhagyaBeku #LokSatta #IAC

18 341Followers
6 056Following
33 066Posts total
74.7KViews on collected posts

Ultimi post

Such news needs to come from Bengaluru as well - 1.5K views · 17 likes · 0 reposts · 0 replies Open on X →
Almost two years after sanctioning one of its flagship infrastructure projects, the Telangana govt has scrapped the KBR Park corridor plan involving 14 flyovers and underpasses. @timesofindia @TOICitiesNews @sunnybaski Read more: https://t.co/ZQ3oFmqy0L 9.1K views · 54 likes · 15 reposts · 5 replies Open on X →
Wonderful to see @CYBTRAFFIC bat for bus! Here’s some math Bus length ~12m Car length ~4m 100 buses = ~3000 people conservative 3000 cars = 3000 people (4500 if we consider 1.5 per car) Road space taken by cars? 10x more than space needed for bus! Emissions? 80% 1K views · 11 likes · 2 reposts · 0 replies Open on X →
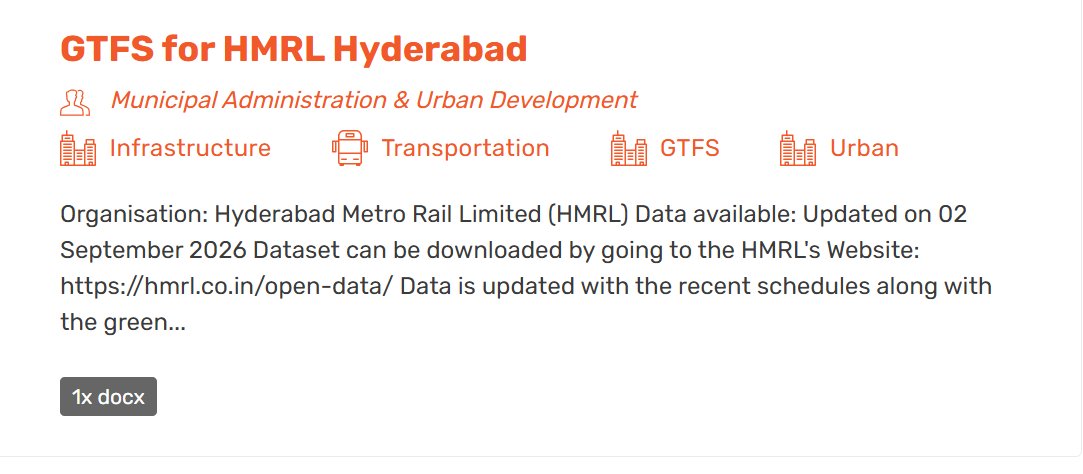
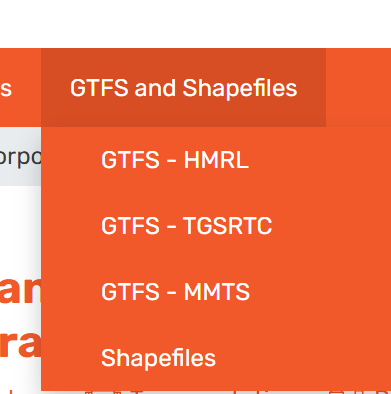
#CyberabadMobilityDatajam #Hyderabad Did you know Government of Telangana publishes open data from all departments? One of the best data repositories I've seen anywhere is here: https://t.co/FNOeeN5lcA Here you have the latest GTFS data for Hyderabad Metro @HMRLHydmetro bus htt
638 views · 9 likes · 2 reposts · 0 replies Open on X →
6 years (369 wards) 0 corporators @BangaloreMirror @sridharvivan "On September 10, 2026, the city marked the sixth anniversary of the last elected council." The article shows the journey of Bengaluru City Corporation over the decades. Do read: https://t.co/jK0xfg8CN3 2.1K views · 53 likes · 19 reposts · 4 replies Open on X →
@srinualavilli Good data. Please also give metro costs per km for different cities 539 views · 7 likes · 0 reposts · 2 replies Open on X →
@AskPerplexity What does it cost to get these buses? How does that compare to the cost of metro? Do you think it is a no brainer to get more buses given the numbers? Why are we not doing it, then? I didn't ask the last question to AI but the first two have been asked and answe
2K views · 19 likes · 4 reposts · 5 replies Open on X →
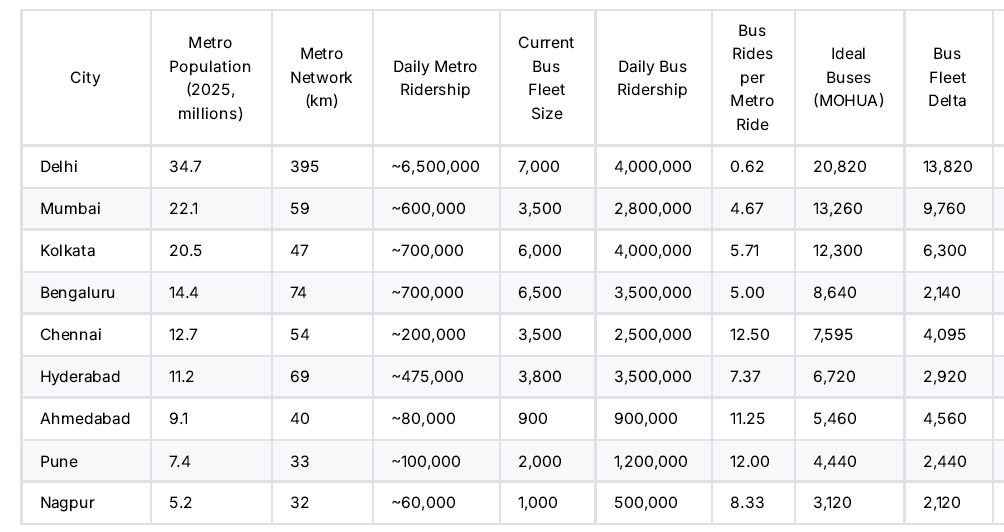
@AskPerplexity So if bus is such a big lifeline for every city, why do we not have enough of them? Long waits in a crowded bus stop battling rain and sun end up with bus arriving crowed and no space to get in. How many buses are needed in each city? How many are actually there
2.4K views · 17 likes · 3 reposts · 3 replies Open on X →
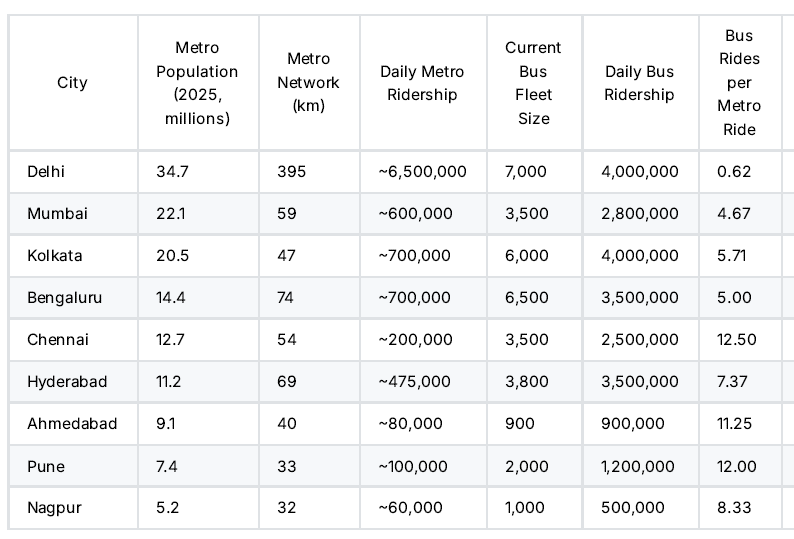
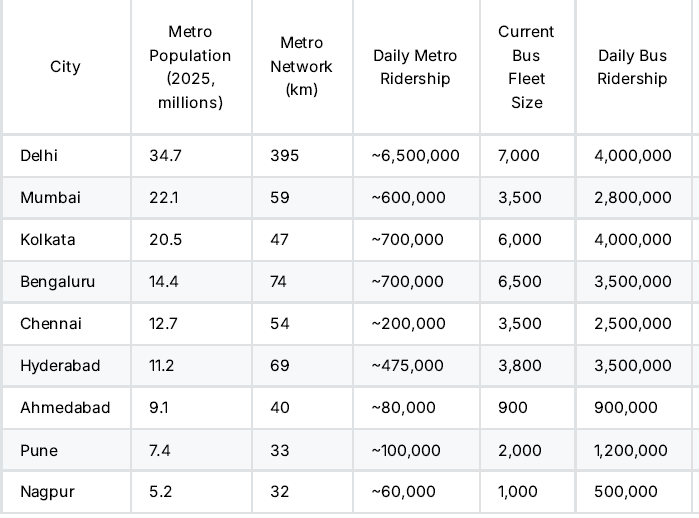
So for every ride that happens on a metro, how many rides happen on buses? Easy for @AskPerplexity to add a column Again, Delhi is the exception here but everywhere else, at least 5x more - Pune has 12x more riders on bus. Nagpur Metro barely has any ridership. https://t.co/Ai
2.7K views · 15 likes · 2 reposts · 4 replies Open on X →
Next up, let's look at the Bus in these cities. How many buses do they have? How much is the daily ridership on the bus? Surprised? While a bus carries may be 50-70 people at one go, by making so many trips, connecting every nook and corner, the bus literally moves the city. ht
3.1K views · 24 likes · 5 reposts · 2 replies Open on X →
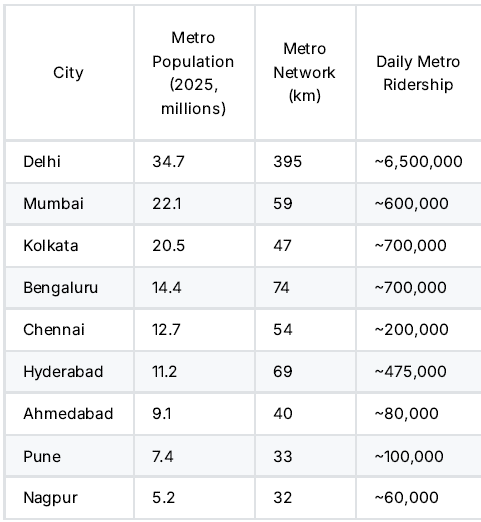
we can see the length of metro in each of these cities but how many people live in these cities and how many of them use the metro daily? Note that daily ridership = number of trips made on a metro or bus. If a person goes from A to B and returns from B to A, that's two http
3.5K views · 24 likes · 1 reposts · 3 replies Open on X →
#PublicTransportIndianCities Have you seen this poster "Metro In India?" It went viral on WhatsApp last few days. It is useful but needs lot more context to understand better. For example, how many people use Metro? How many people use bus in these cities? How much was spent h
46.1K views · 191 likes · 44 reposts · 24 replies Open on X →

Rispetto ad account della stessa dimensione

5 post degli ultimi 90 giorni, accanto alla fascia di 10K–100K follower. arriva a più persone rispetto ad account della stessa dimensione.

Visualizzazioni mediane1 503questo account924mediana per 10K–100K
Copertura, %8.19%questo account3.62%mediana per 10K–100K
Interazione, %1.29%questo account1.52%mediana per 10K–100K
MetricaQuesto accountMediana per 10K–100KRapporto
Visualizzazioni mediane per post1 5039241.63×
Copertura (visualizzazioni ÷ follower)8.19%3.62%2.26×
Tasso di interazione1.29%1.52%0.85×

Altri account di questa fascia →   Confronta con un altro account →   Come sono costruiti questi parametri →

Growth & engagement

How the posts we collected actually performed: views and reaction rate post by post, what the audience did with them, and where the follower count goes.

Views per post

46.1K28 May
3.5K
3.1K
2.7K
2.4K
2K
539
2.1K14 Sep
63817 Sep
1K
9.1K18 Sep
1.5K

Last 12 collected posts, oldest on the left. The scale is logarithmic: one post can outrun the rest a hundred times over.

Engagement rate per post

0.58%28 May
0.83%
1.00%
0.78%
0.96%
1.38%
1.67%
3.69%14 Sep
1.72%17 Sep
1.29%
0.91%18 Sep
1.13%

Reactions — likes, reposts, replies and quotes — divided by views. Median for 10K–100K accounts is 1.52%.

What the audience does

Likes65.2%441 in total
Reposts14.3%97 in total
Replies7.7%52 in total
Quotes3.0%20 in total
Bookmarks9.8%66 in total

Share of every reaction we collected for this account. Replies mean argument, reposts mean endorsement, bookmarks mean the post was worth keeping.

The follower curve appears once this account has two daily snapshots — we take one a day, and this one is on its first.

Account simili