tweetindex
PT

EIA ✓

@EIAgov · Washington, DC · joined 15 Jul 2009

Independent statistics and analysis from the U.S. Energy Information Administration. Official account. We try to respond to all the questions we receive here.

186 273Followers
373Following
28 890Posts total
90.9KViews on collected posts

Posts recentes

Public companies produce most U.S. crude oil and natural gas. #TodayInEnergy https://t.co/lR37YZYS2E https://t.co/6yC7XlMplC
5.4K views · 26 likes · 10 reposts · 2 replies Open on X →
EIA Administrator @EIA_One Tristan Abbey was in Steel City today to deliver a keynote address in the Distinguished Lecture series @CarnegieMellon @CMUenergy, as part of our continuing #AEO2026 road show. https://t.co/V33F6IpVWG
6.5K views · 11 likes · 1 reposts · 5 replies Open on X →
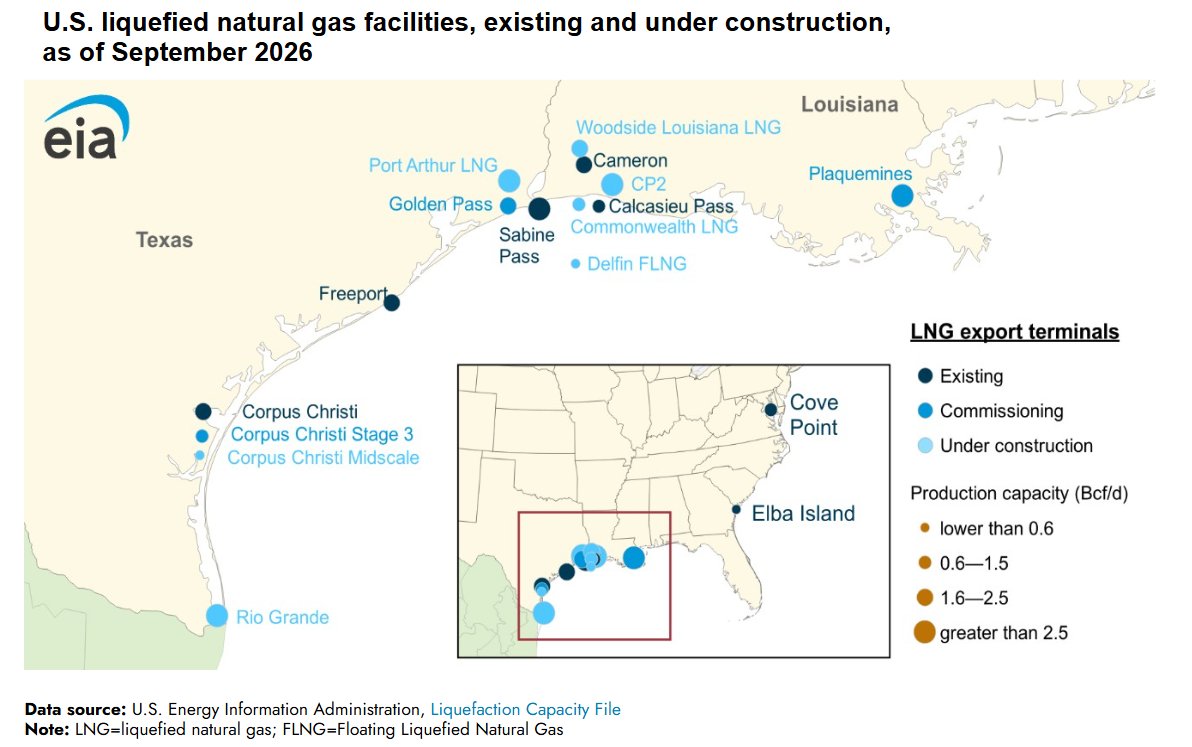
Corpus Christi #LNG expansion makes facility the second-largest in the United States. #TodayInEnergy https://t.co/PP7dTO6IfX https://t.co/E4OhLc1Xxh
5.1K views · 30 likes · 11 reposts · 3 replies Open on X →
United States on track for record #crudeoil production in 2026. #TodayInEnergy https://t.co/cJpqUqi4Nl https://t.co/067f7F0shC
7.4K views · 36 likes · 22 reposts · 7 replies Open on X →
At an @Axios event today, @EIA_One Administrator Tristan Abbey discussed EIA modernization reforms achieved in 2026 with @Ben_Geman, including 30 pilot studies—the most we’ve ever completed in any single year. He also named highlights from the 2027 agenda. 🧵#AxiosLive https://t.c
5.1K views · 11 likes · 3 reposts · 2 replies Open on X →
Elevated crack spreads and crude oil prices contribute to higher prices at the pump. #gasoline #TodayInEnergy https://t.co/EwvQdZssP5 https://t.co/KQTr5ufn58 5.4K views · 53 likes · 21 reposts · 1 replies Open on X →
Weekly average load in ERCOT continues near record high. #TodayInEnergy https://t.co/hsFS8MV4EG https://t.co/nYDsFR3ZjA 5.7K views · 25 likes · 4 reposts · 2 replies Open on X →
@EIAgov Thank you for the chart. The important word in your headline is capacity. The extra cargoes came from new trains. Plaquemines and Corpus Christi Stage 3 added the gas. The older plants were already running near full. March showed what that means. Hormuz took a fifth of 92 views · 0 likes · 0 reposts · 1 replies Open on X →
@EIAgov 23% H1, Henry Hub still sub-$3. Export story real. Domestic pricing tension is the part nobody's written about yet. 41 views · 0 likes · 0 reposts · 0 replies Open on X →
@EIAgov Chokepoints are losing leverage to liquefaction. Hormuz cut 20% of global LNG supply, yet the market rerouted because someone else had trains under construction. I've spent years studying power transitions; capacity is the new geography. 73 views · 0 likes · 0 reposts · 0 replies Open on X →
U.S. #LNG exports rose 23% in the first half of 2026. #TodayInEnergy https://t.co/79aq0H2nxE https://t.co/i6lDZvBust 24.2K views · 147 likes · 47 reposts · 8 replies Open on X →
⚛️ U.S. #uranium production more than tripled in 2025 and was the highest since 2017. #TodayInEnergy https://t.co/WQC1LsgLq7 https://t.co/JqpXfANj7B 6.5K views · 41 likes · 12 reposts · 4 replies Open on X →
🆕 Monthly Energy Review available now: https://t.co/RhReS9wKz2 Preliminary estimates indicate that total U.S. residential energy consumption equaled 1.2 quadrillion British thermal units in May 2026, a 1% increase from May 2025. https://t.co/bJxFNhXIDe 5.8K views · 24 likes · 5 reposts · 2 replies Open on X →
Our Liquids Pipeline Projects Database has tracked the completion of 8 liquid fuels pipeline projects since the start of 2025, with an additional 14 new projects announced. #TodayInEnergy https://t.co/Ynq5hb20AV https://t.co/1Cb2nEnHvA 6.3K views · 15 likes · 2 reposts · 2 replies Open on X →
Dangote refinery drives increase in petroleum shipments from Nigeria. #TodayInEnergy https://t.co/dedbV9Gk1n https://t.co/fSGMO7z6ao 7.2K views · 9 likes · 7 reposts · 1 replies Open on X →

Em comparação com contas do mesmo porte

15 posts dos últimos 90 dias, ao lado da faixa de 100K–1M seguidores. aparece para muita gente, mas poucos desses espectadores reagem.

Mediana de visualizações5 655esta conta5 983mediana para 100K–1M
Alcance, %3.04%esta conta1.49%mediana para 100K–1M
Engajamento, %0.57%esta conta0.93%mediana para 100K–1M
MétricaEsta contaMediana para 100K–1MProporção
Mediana de visualizações por post5 6555 9830.95×
Alcance (visualizações ÷ seguidores)3.04%1.49%2.04×
Taxa de engajamento0.57%0.93%0.61×

Outras contas desta faixa →   Comparar com outra conta →   Como estas referências são construídas →

Growth & engagement

How the posts we collected actually performed: views and reaction rate post by post, what the audience did with them, and where the follower count goes.

Views per post

6.3K26 Aug
5.8K28 Aug
6.5K
24.2K1 Sep
73
412 Sep
92
5.7K3 Sep
5.4K4 Sep
5.1K15 Sep
7.4K17 Sep
5.1K
6.5K
5.4K22 Sep

Last 14 collected posts, oldest on the left. The scale is logarithmic: one post can outrun the rest a hundred times over.

Engagement rate per post

0.30%26 Aug
0.54%28 Aug
0.90%
0.90%1 Sep
0.00%
0.00%2 Sep
1.09%
0.57%3 Sep
1.41%4 Sep
0.33%15 Sep
0.92%17 Sep
0.88%
0.28%
0.70%22 Sep

Reactions — likes, reposts, replies and quotes — divided by views. Median for 100K–1M accounts is 0.93%.

What the audience does

Likes59.5%428 in total
Reposts20.2%145 in total
Replies5.6%40 in total
Quotes3.6%26 in total
Bookmarks11.1%80 in total

Share of every reaction we collected for this account. Replies mean argument, reposts mean endorsement, bookmarks mean the post was worth keeping.

The follower curve appears once this account has two daily snapshots — we take one a day, and this one is on its first.

Contas semelhantes