tweetindex
PT

JWeiland

@JPWeiland · joined 15 May 2012

Scientist. Infectious disease modeler. Tweets and spelling mistakes are my own Models and analysis seen on @Newsweek @Fortunemagazine @FaceTheNation @TIME

30 299Followers
239Following
7 876Posts total
332.6KViews on collected posts

Posts recentes

3 1/2 years ago, I was talking about this exact scenario. Now we have benchtop DNA printers AND advanced AI capability to design novel viruses. Not good for the survival of humanity. https://t.co/YEwgSgbi3t
8.9K views · 64 likes · 19 reposts · 1 replies Open on X →
For those of you who didn't want to click to the 2nd tweet in this thread, let me be more specific The convergence of AI and biological engineering is making building bioweapons easier and easier We are doing almost nothing to prevent or prepare for this reality 36.7K views · 674 likes · 187 reposts · 12 replies Open on X →
Regional trends are shown here from Biobot. I think we are about a week from the peak, as trends typically reverse a few weeks after schools return. We will see if that pattern from previous years holds up on this late wave. Not shown: much bigger 2024 summer wave reaching 1000.
12.3K views · 191 likes · 23 reposts · 5 replies Open on X →
Sept 5th Update: As mentioned in June, a relatively small late summer wave is occurring in the West and South, less than half numbers last summer. Midwest and NE are still at minimal levels. 🔸️180k infections/day 🔸️1 in 350 currently infectious 🔸️W+S about 3x MW+NE https://t.
30.8K views · 274 likes · 43 reposts · 14 replies Open on X →
Hantavirus update: *Nailed it* 10.6K views · 63 likes · 6 reposts · 1 replies Open on X →
🔸️Wastewater levels on both WWScan and Biobot remain at rock bottom levels. 5-8x lower than previous lulls and 50-80x lower than our last big waves in 2024. 🔸️<40k infections/day 🔸️We may still see a small late summer wave for the West and South. https://t.co/dmedFwXKNK
37.4K views · 377 likes · 44 reposts · 21 replies Open on X →
That being said, the right move is to contact trace, serial testing of contacts, and quarantine of suspected cases. Even though this is unlikely to become a wider issue, you'd still prefer to stamp out small fires before more people are affected or killed. 6.1K views · 100 likes · 7 reposts · 2 replies Open on X →
Its like trying to start a wildfire in a damp forest. You might find some places where it spreads a bit and then goes out, and most of the time it never spreads at all. Looking only at the one time it spread a bit and saying "look at the exponential spread!" is not scientific. 8K views · 121 likes · 5 reposts · 4 replies Open on X →
@JPWeiland Berger burger is a fearmonger. I’m sure the next whatever outbreak we have he’ll go nuts about too. 1.1K views · 13 likes · 0 reposts · 1 replies Open on X →
So everyone is clear on this: Superspreading events are not natural R0. There are about 100 cases of ANDV per year the vast majority are from direct exposure to rodent waste and never pass forward. Can't ignore those. True R0 is probably ~0.5 or less 74.9K views · 369 likes · 39 reposts · 17 replies Open on X →
@JPWeiland @pberrini And yet so many of my students are sick.... What's going around instead? 1.9K views · 18 likes · 1 reposts · 7 replies Open on X →
@JPWeiland Meanwhile the Facebook groups are crashing out as members share that they’ve decided to indoor dine for the first time in 6 years. 2.3K views · 18 likes · 1 reposts · 3 replies Open on X →
@JPWeiland I know these “lows” are relative and great news for now … but what we wouldn’t give for it to go down below the x axis and just keep running…. 1.6K views · 23 likes · 0 reposts · 0 replies Open on X →
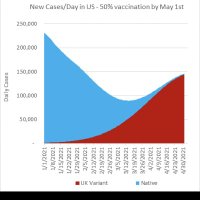
April 24th Update: We are at the lowest transmission levels in almost 5 years, 40% lower than our recent spring lows. This remarkable lull should last 6+more weeks. Estimates: 🔸90,000 new infections/day 🔸~1 in 750 currently reasonably infectious (5 day window) https://t.
100.2K views · 689 likes · 96 reposts · 36 replies Open on X →

Em comparação com contas do mesmo porte

5 posts dos últimos 90 dias, ao lado da faixa de 10K–100K seguidores. aparece para muita gente, mas poucos desses espectadores reagem.

Mediana de visualizações12 281esta conta924mediana para 10K–100K
Alcance, %40.53%esta conta3.62%mediana para 10K–100K
Engajamento, %1.07%esta conta1.52%mediana para 10K–100K
MétricaEsta contaMediana para 10K–100KProporção
Mediana de visualizações por post12 28192413.3×
Alcance (visualizações ÷ seguidores)40.53%3.62%11.2×
Taxa de engajamento1.07%1.52%0.71×

Outras contas desta faixa →   Comparar com outra conta →   Como estas referências são construídas →

Growth & engagement

How the posts we collected actually performed: views and reaction rate post by post, what the audience did with them, and where the follower count goes.

Views per post

100.2K24 Apr
1.6K
2.3K
1.9K25 Apr
74.9K6 May
1.1K
8K
6.1K7 May
37.4K27 Jun
10.6K5 Sep
30.8K
12.3K8 Sep
36.7K11 Sep
8.9K

Last 14 collected posts, oldest on the left. The scale is logarithmic: one post can outrun the rest a hundred times over.

Engagement rate per post

0.82%24 Apr
1.48%
0.96%
1.35%25 Apr
0.57%6 May
1.22%
1.63%
1.79%7 May
1.18%27 Jun
0.66%5 Sep
1.07%
1.78%8 Sep
2.38%11 Sep
0.94%

Reactions — likes, reposts, replies and quotes — divided by views. Median for 10K–100K accounts is 1.52%.

What the audience does

Likes75.8%2 994 in total
Reposts11.9%471 in total
Replies3.1%124 in total
Bookmarks9.2%362 in total

Share of every reaction we collected for this account. Replies mean argument, reposts mean endorsement, bookmarks mean the post was worth keeping.

The follower curve appears once this account has two daily snapshots — we take one a day, and this one is on its first.

Contas semelhantes