tweetindex
PT

Daniel Swain

@Weather_West · joined 11 Nov 2013

Weather and climate scientist focused on extreme events like floods, droughts, & wildfires on a warming planet.

108 363Followers
2 967Following
44 278Posts total
255.1KViews on collected posts

Posts recentes

Fielding questions re: this article w/bizarre factual errors. First, there's no "Montecito County" in CA. Second, 2 fires are actually in *Monterey,* & 3rd in *Mendocino*. Third, 60k ac have *not* burned in either fictional Montecito nor real Mendocino.🤨 https://t.co/bl5tPxt2pH 24.8K views · 434 likes · 58 reposts · 33 replies Open on X →
If you missed it live, and are interested in this year's extreme El Niño event and its potential to bring major California impacts, I'd strongly encourage you to check out the recording! I even created some custom graphics just for this session... https://t.co/YG5ZnvHPps 25.1K views · 276 likes · 60 reposts · 9 replies Open on X →
I can now announce that, thanks to the support of the philanthropic funders behind the Climate Science and Communication Fund, the NSIDC Sea Ice Today blog has now returned (albeit in somewhat scaled back form)! https://t.co/QSlXnzWq9W 8.5K views · 124 likes · 14 reposts · 2 replies Open on X →
@Weather_West @imetrich Santa Cruz just hit 101° on Central Coast. https://t.co/ZNc6BqjPxW
361 views · 6 likes · 1 reposts · 1 replies Open on X →
@Weather_West This is in NW Anaheim. I'm dying, Daniel. Make it stop D: https://t.co/wJaYOaXN8r
307 views · 8 likes · 0 reposts · 0 replies Open on X →
@Weather_West It. Is. Insane. https://t.co/mwUhg1UE1L
232 views · 7 likes · 0 reposts · 0 replies Open on X →
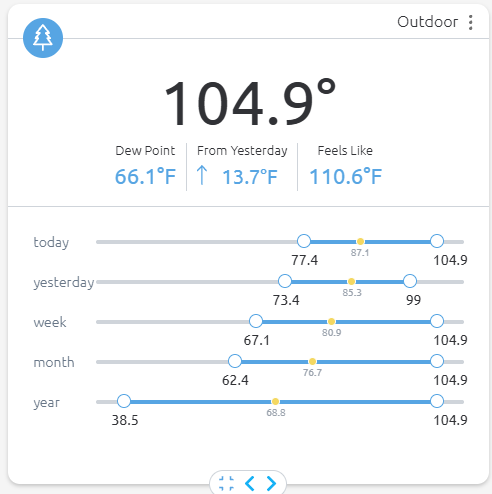
With widespread temperatures in 95-105F range, plus very high humidity (dew points mostly 65-70F), heat index/apparent temperatures are now 105-110F across most of SoCal, with pockets of 110-115F. Peak may be a bit higher still later this PM. This humid heatwave is no joke! #CAwx
Snapshot of current observed heat index values across SoCal from a NWS map.
26.5K views · 367 likes · 64 reposts · 25 replies Open on X →
@Weather_West @jesseXjesse Invaluable. The State of California is really getting their money’s worth this year. 701 views · 7 likes · 2 reposts · 0 replies Open on X →
You can download the original factsheet directly from UC ANR (see below), and you are encouraged to share widely! https://t.co/UV3QC95re5 4.9K views · 46 likes · 8 reposts · 4 replies Open on X →
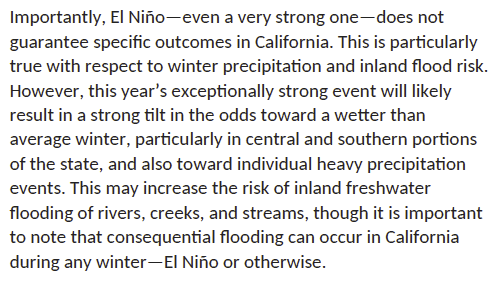
Importantly, El Niño—even a very strong one—does not guarantee specific outcomes in California. However, this year’s exceptionally strong event will likely result in a strong tilt in the odds toward a wetter than average winter, and also toward individual heavy rain events. https
Screenshot of factsheet subsection text. It reads: "Importantly, El Niño—even a very strong one—does not guarantee specific outcomes in California. This is particularly true with respect to winter precipitation and inland flood risk. However, this year’s exceptionally strong event will likely result in a strong tilt in the odds toward a wetter than average winter, particularly in central and southern portions of the state, and also toward individual heavy precipitation events. This may increase the risk of inland freshwater flooding of rivers, creeks, and streams, though it is important to note that consequential flooding can occur in California during any winter—El Niño or otherwise."
20.1K views · 66 likes · 4 reposts · 6 replies Open on X →
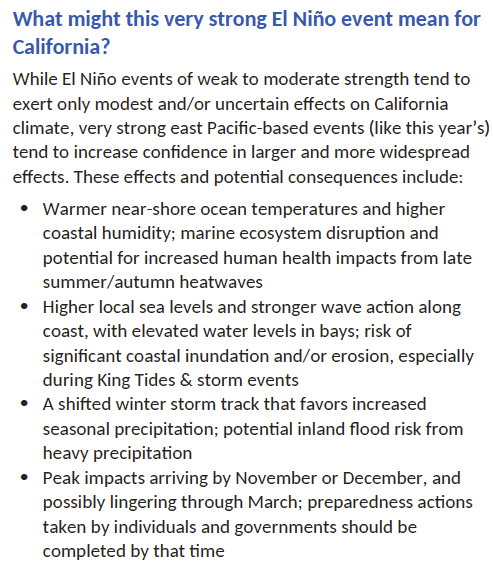
While weak-moderate El Niño events exert modest/uncertain effects on California climate, very strong ones will likely cause: 1) Warmer near-shore ocean temperatures, 2) Higher sea levels and stronger wave action, & 3) Shifted winter storm track favoring increased seasonal precip
Screenshot of fact sheet subsection text. It begins: "What might this very strong El Niño event mean for California?
While El Niño events of weak to moderate strength tend to exert only modest and/or uncertain effects on California climate, very strong east Pacific-based events (like this year’s) tend to increase confidence in larger and more widespread effects. These effects and potential consequences include:
•	Warmer near-shore ocean temperatures and higher coastal humidity; marine ecosystem disruption and potential for increased human health impacts from late summer/autumn heatwaves 
•	Higher local sea levels and stronger wave action along coast, with elevated water levels in bays; risk of significant coastal inundation and/or erosion, especially during King Tides & storm events
•	A shifted winter storm track that favors increased seasonal precipitation; potential inland flood risk from heavy precipitation
•	Peak impacts arriving by November or December, and possibly lingering..."
4.3K views · 44 likes · 3 reposts · 1 replies Open on X →
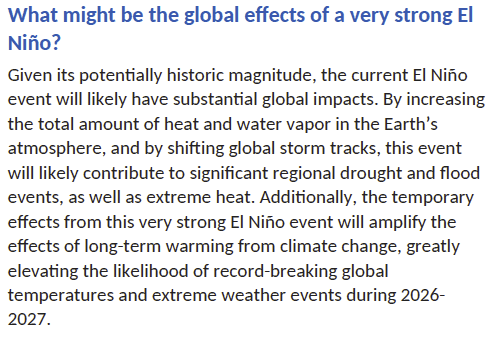
Given potentially historic magnitude, the current El Niño event will have substantial global impacts. This event will likely contribute to regional drought & flood events. Additionally, its temporary effects will amplify effects of long-term warming from climate change. https://t
Screenshot of fact sheet subsection text. It reads: "What might be the global effects of a very strong El Niño?
Given its potentially historic magnitude, the current El Niño event will likely have substantial global impacts. By increasing the total amount of heat and water vapor in the Earth’s atmosphere, and by shifting global storm tracks, this event will likely contribute to significant regional drought and flood events, as well as extreme heat. Additionally, the temporary effects from this very strong El Niño event will amplify the effects of long-term warming from climate change, greatly elevating the likelihood of record-breaking global temperatures and extreme weather events during 2026-2027."
4.3K views · 49 likes · 9 reposts · 1 replies Open on X →
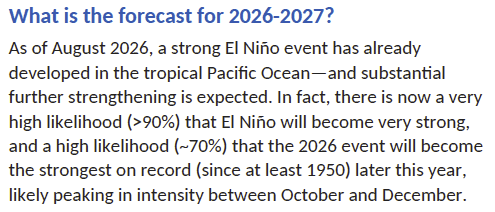
As of August, a strong El Niño event has already developed—and substantial further strengthening is expected. In fact, there's now very high likelihood (>90%) that El Niño will become very strong, and high likelihood (~70%) that the 2026 event will become the strongest on record.
Screenshot of fact sheet subsection text. It reads: "What is the forecast for 2026-2027?
As of August 2026, a strong El Niño event has already developed in the tropical Pacific Ocean—and substantial further strengthening is expected. In fact, there is now a very high likelihood (>90%) that El Niño will become very strong, and a high likelihood (~70%) that the 2026 event will become the strongest on record (since at least 1950) later this year, likely peaking in intensity between October and December."
4.5K views · 58 likes · 7 reposts · 1 replies Open on X →
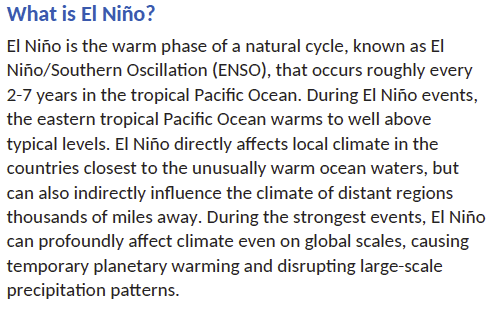
El Niño is the warm phase of a natural cycle (ENSO) occurring every 2-7 years in tropical Pacific Ocean. El Niño directly affects local climate in places closest to unusually warm ocean waters, but can also indirectly influence climate of distant regions thousands of miles away.
Screenshot of text from factsheet subsection. It reads: "What is El Niño?
El Niño is the warm phase of a natural cycle, known as El Niño/Southern Oscillation (ENSO), that occurs roughly every 2-7 years in the tropical Pacific Ocean. During El Niño events, the eastern tropical Pacific Ocean warms to well above typical levels. El Niño directly affects local climate in the countries closest to the unusually warm ocean waters, but can also indirectly influence the climate of distant regions thousands of miles away. During the strongest events, El Niño can profoundly affect climate even on global scales, causing temporary planetary warming and disrupting large-scale precipitation patterns."
5.1K views · 48 likes · 7 reposts · 1 replies Open on X →
Given rising interest in the rapidly strengthening El Niño event in the tropical Pacific Ocean, I've created a one-page fact sheet succinctly describing what El Niño is, this year's (remarkable) forecast, and potential impacts from California to global scales. [Thread] https://t
JPEG version of a 1-page Factsheet: El Niño 2026-2027: A Potentially Historic Global Climate Event
By Daniel Swain, PhD | August 2026

There is a banner image depicting projected warming of the Pacific Ocean by early winter.

The content begins:
"What is El Niño?
El Niño is the warm phase of a natural cycle, known as El Niño/Southern Oscillation (ENSO), that occurs roughly every 2-7 years in the tropical Pacific Ocean. During El Niño events, the eastern tropical Pacific Ocean warms to well above typical levels. El Niño directly affects local climate in the countries closest to the unusually warm ocean waters, but can also indirectly influence the climate of distant regions thousands of miles away. During the strongest events, El Niño can profoundly affect climate even on global scales, causing temporary planetary warming and disrupting large-scale precipitation patterns..."
101.2K views · 1.3K likes · 335 reposts · 30 replies Open on X →
I've been talking a lot about the disastrous recent loss of American institutional capacity regarding climate science. But today, I'd like to announce something we've been working on, quietly, in the meantime to offer a lifeline to some of those affected. [Thread] https://t.co/Dh
First page of a 2-page flyer describing the Climate Science and Communications Fund. It shows a map of gift recipient locations, and also summarize statistics regarding the program thus far (including over $3 million disbursed to date), with testimonials from individual recipients.
Second page of a 2-page flyer describing the Climate Science and Communications Fund. It further describes the need for and goals of the program. It also includes a point of contact email: roshan@climate-talent.org
24.4K views · 378 likes · 102 reposts · 4 replies Open on X →

Em comparação com contas do mesmo porte

16 posts dos últimos 90 dias, ao lado da faixa de 100K–1M seguidores. aparece muito além do próprio público, e esse público reage.

Mediana de visualizações4 982esta conta5 906mediana para 100K–1M
Alcance, %4.60%esta conta1.59%mediana para 100K–1M
Engajamento, %1.55%esta conta1.04%mediana para 100K–1M
MétricaEsta contaMediana para 100K–1MProporção
Mediana de visualizações por post4 9825 9060.84×
Alcance (visualizações ÷ seguidores)4.60%1.59%2.89×
Taxa de engajamento1.55%1.04%1.49×

Outras contas desta faixa →   Comparar com outra conta →   Como estas referências são construídas →

Growth & engagement

How the posts we collected actually performed: views and reaction rate post by post, what the audience did with them, and where the follower count goes.

Views per post

5.1K20 Aug
4.5K
4.3K
4.3K
20.1K
4.9K
701
26.5K9 Sep
232
307
361
8.5K10 Sep
25.1K
24.8K13 Sep

Last 14 collected posts, oldest on the left. The scale is logarithmic: one post can outrun the rest a hundred times over.

Engagement rate per post

1.10%20 Aug
1.46%
1.39%
1.13%
0.38%
1.19%
1.28%
1.72%9 Sep
3.02%
2.61%
2.22%
1.64%10 Sep
1.37%
2.12%13 Sep

Reactions — likes, reposts, replies and quotes — divided by views. Median for 100K–1M accounts is 1.04%.

What the audience does

Likes68.2%3 236 in total
Reposts14.2%674 in total
Replies2.5%118 in total
Bookmarks15.1%716 in total

Share of every reaction we collected for this account. Replies mean argument, reposts mean endorsement, bookmarks mean the post was worth keeping.

The follower curve appears once this account has two daily snapshots — we take one a day, and this one is on its first.

Contas semelhantes