tweetindex
PT

Pew Research Center ✓

@pewresearch · Washington, DC · joined 03 Mar 2009

Nonpartisan, nonadvocacy data and analysis. Follow us on Instagram, Facebook and LinkedIn or subscribe to our newsletters: https://t.co/tawtYBr8Ef ✉️

416 911Followers
204Following
104 101Posts total
67.7KViews on collected posts

Posts recentes

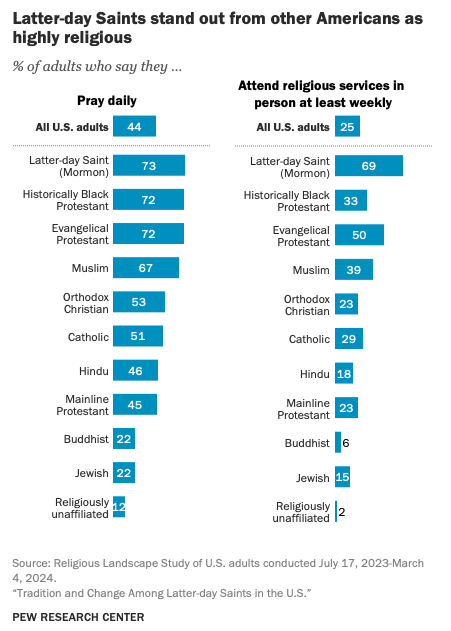
Latter-day Saints are, on average, among the most religious Americans. For example, roughly seven-in-ten Latter-day Saints say that: 🔹Religion is very important in their lives. 🔹They pray daily 🔹They attend religious services in person at least weekly. https://t.co/w0wP5
Chart showing roughly 7 in 10 Latter-day Saints say religion is very important to their lives
Chart showing Latter-day Saints stand out from other Americans as highly religious
3.7K views · 17 likes · 5 reposts · 1 replies Open on X →
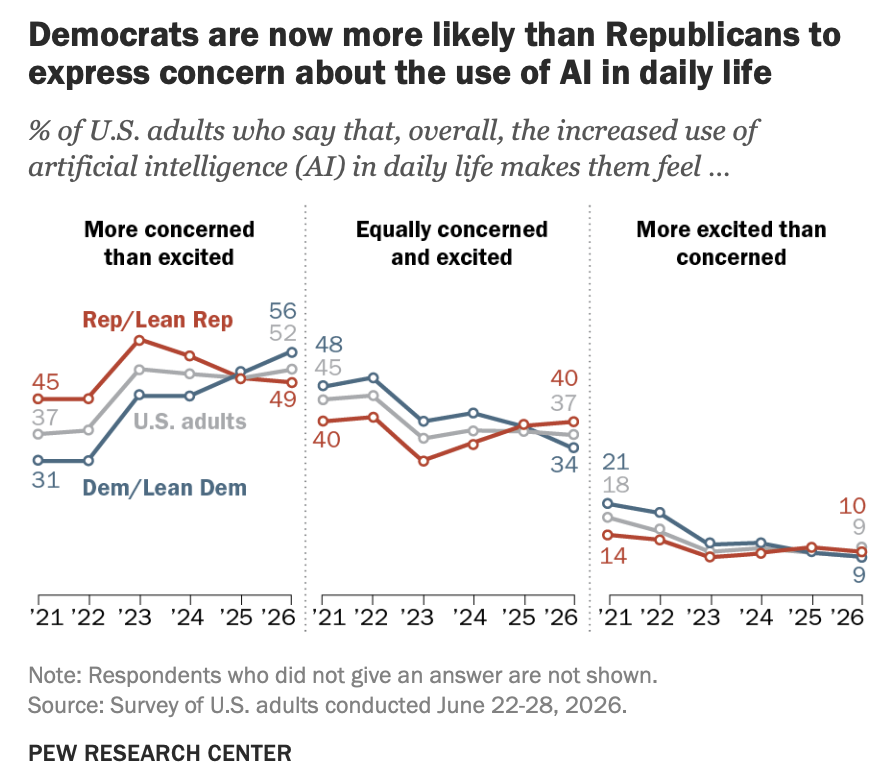
For the first time, Democrats are more likely than Republicans to be concerned about the increased use of AI in daily life. 📈 56% of Democrats say they are more concerned than excited about the growing use of AI in daily life, up 25 percentage points since we first asked in htt
Split chart comparing Republicans and Democrats who are more concerned than excited, equally concerned and excited, and more excited than concerned about the growing use of AI in daily life.
3.4K views · 11 likes · 3 reposts · 1 replies Open on X →
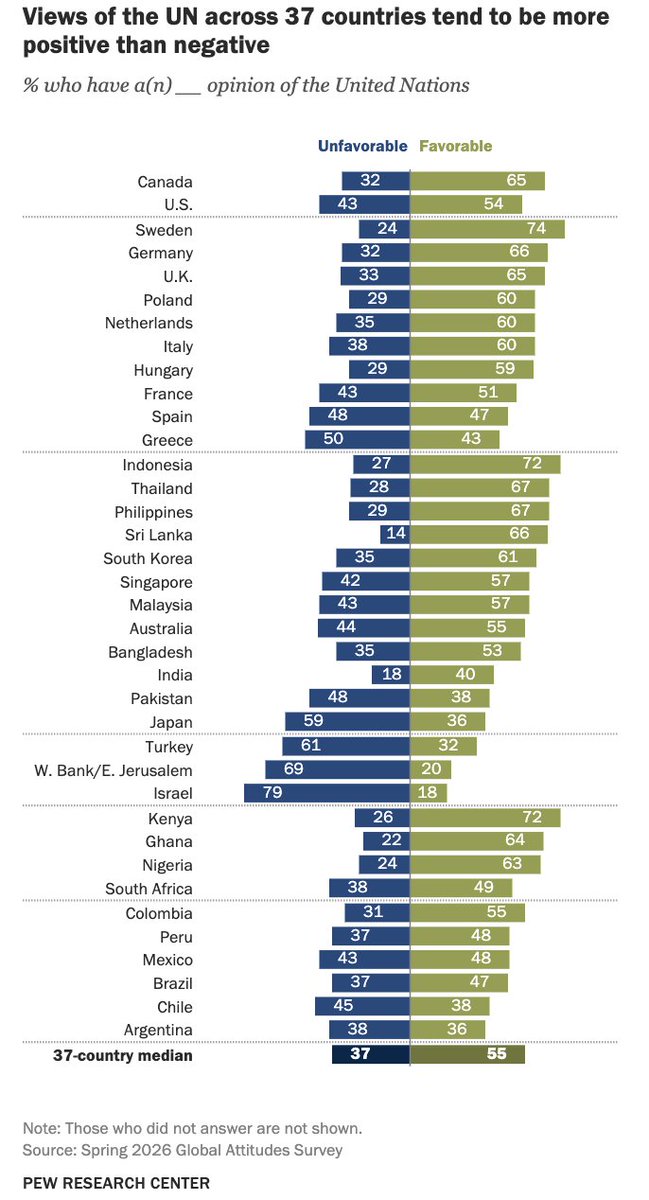
The United Nations General Assembly (#UNGA) opened their 81st session earlier this month and General Debate starts today. 🇺🇳 🌐 People across 37 countries view the UN more favorably than unfavorably. However, views in some countries have turned more negative in recent https
Chart showing views of the UN across 37 countries tend to be more positive than negative.
4.8K views · 9 likes · 15 reposts · 1 replies Open on X →
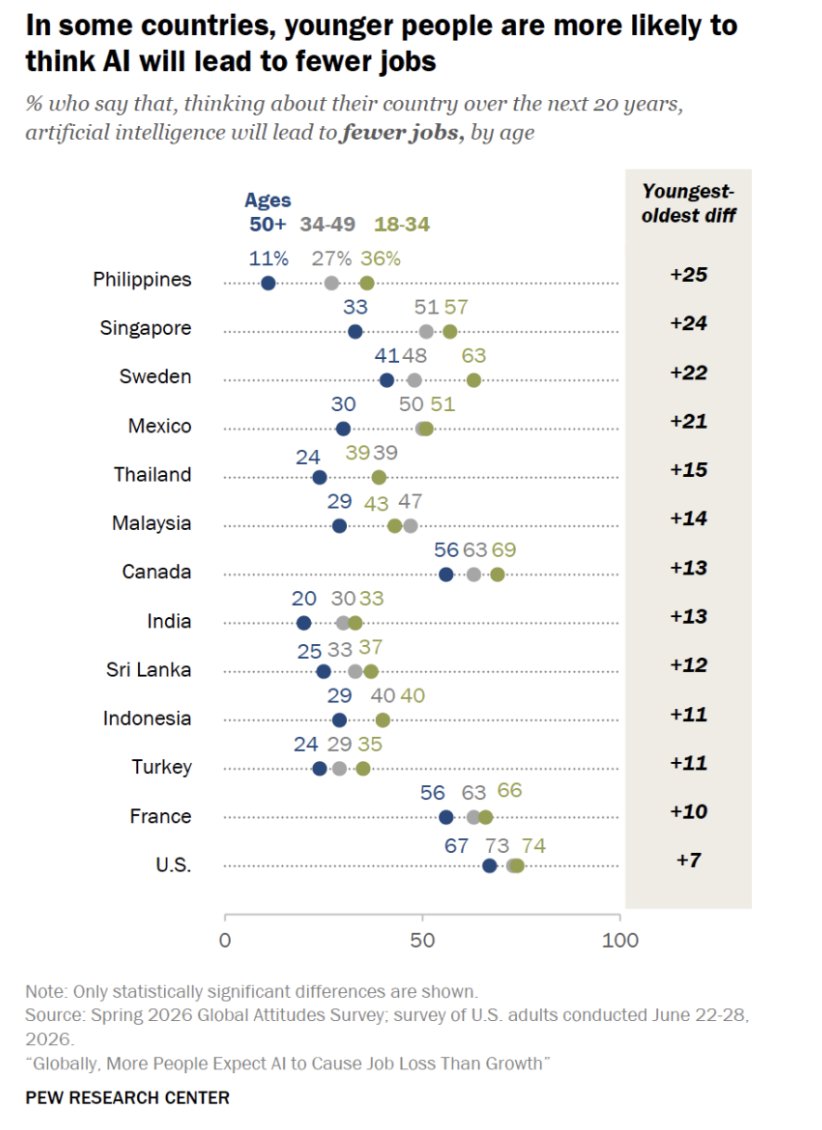
In some countries, younger adults (ages 18 to 34) are more concerned about AI-related job loss than adults ages 50 and older. Older adults tend to be more concerned about the increased use of AI in daily life in general, though younger adults’ concerns appear to be growing in h
Chart showing that in some countries, younger people are more likely to think AI will lead to fewer jobs
Chart showing older people are more concerned about AI than younger people
Chart showing young adults’ concern about AI is up in 6 countries
6K views · 20 likes · 10 reposts · 1 replies Open on X →
Three ways to correct a poll’s political balance: weight on self-reported party affiliation, self-reported past vote, or voter file data such as party registration. Each has strengths and weaknesses. No one approach is clearly superior in all contexts. #PollingMethods https:/
Three ways to weight a poll on political party or vote
4.6K views · 18 likes · 7 reposts · 0 replies Open on X →
The share of Americans who say it’s extremely or very important to them personally to see a woman president is unchanged from 2023, with 18% saying this in each survey. How important is seeing a woman president to you? ⬇️ #WomenLeaders https://t.co/7tHoUnxQdF 4K views · 9 likes · 1 reposts · 2 replies Open on X →
48% of U.S.-born Latinos say the American dream is now harder to achieve than it was for their parents, while 35% of immigrant Latinos say the same. https://t.co/z4vxvg2RIh 4.3K views · 8 likes · 7 reposts · 0 replies Open on X →
Do countries view the United Nations favorably or unfavorably? 🇺🇳 Views of the #UN have become more negative in 10 countries since we last asked this question. https://t.co/OrivZRTHYU 3.4K views · 13 likes · 5 reposts · 0 replies Open on X →
10% of U.S. adults today were born after 2001 and only know about the 9/11 attacks from what they’ve learned from others. 60% of these young adults, 18-24 years old now, say they first learned about the attacks in class or through schoolwork. How did you first learn about 4.1K views · 7 likes · 9 reposts · 2 replies Open on X →
What does the American dream mean to U.S. Latinos? About six-in-ten Latinos tie it to financial or economic factors, including homeownership. #AmericanDream https://t.co/kxThRcZadG 3.9K views · 6 likes · 5 reposts · 0 replies Open on X →
How likely is it that the U.S. will elect a woman as president? 🇺🇸 Growing shares say it’s not likely a woman will be elected president in their lifetime. 37% of Americans now say it’s not likely that the U.S. will elect a woman as president, up from 26% in 2023. https://t.co/ 4.2K views · 12 likes · 2 reposts · 6 replies Open on X →
@pewresearch Does it count if you know you werent alive? 22 views · 0 likes · 0 reposts · 0 replies Open on X →
@pewresearch Yep I remember vividly. 24 views · 0 likes · 0 reposts · 0 replies Open on X →
New York City schools are pausing student-facing generative AI for students 2-K through 8th grade. 🤖 Our research finds 54% of U.S. teens have used AI chatbots for schoolwork. Specifically, 48% have used them to research a topic, 43% have used them to solve a math problem, and 4.6K views · 12 likes · 13 reposts · 0 replies Open on X →
@pewresearch I do and I'm not American, wasn't in America at the time. 27 views · 0 likes · 0 reposts · 0 replies Open on X →
83% of adults who were born before 2001 – including 93% of those who were 10 or older at the time – say they recall exactly where they were or what they were doing when they heard the news about the Sept. 11 terrorist attacks. https://t.co/AgniSmUVUZ 8.3K views · 43 likes · 21 reposts · 3 replies Open on X →
What does it take to achieve the “American dream”? Among Latinos who believe the American dream exists, large majorities say hard work and motivation (81%) and access to the right opportunities (76%) are major factors in achieving it. #AmericanDream #USLatinos https://t.co/kw 3.2K views · 9 likes · 3 reposts · 0 replies Open on X →
@pewresearch Whites and Asians are the only net tax contributors. 35 views · 1 likes · 0 reposts · 0 replies Open on X →
About six-in-ten White (62%) and Hispanic adults (59%) overall view themselves as working class, as do roughly half of Black (54%) and Asian adults (52%). Working class identification also varies by education and partisanship. https://t.co/rR0XlTou1K 5.1K views · 11 likes · 8 reposts · 2 replies Open on X →

Em comparação com contas do mesmo porte

19 posts dos últimos 90 dias, ao lado da faixa de 100K–1M seguidores. abaixo dos pares tanto em alcance quanto em engajamento.

Mediana de visualizações3 950esta conta5 983mediana para 100K–1M
Alcance, %0.95%esta conta1.49%mediana para 100K–1M
Engajamento, %0.44%esta conta0.93%mediana para 100K–1M
MétricaEsta contaMediana para 100K–1MProporção
Mediana de visualizações por post3 9505 9830.66×
Alcance (visualizações ÷ seguidores)0.95%1.49%0.64×
Taxa de engajamento0.44%0.93%0.47×

Outras contas desta faixa →   Comparar com outra conta →   Como estas referências são construídas →

Growth & engagement

How the posts we collected actually performed: views and reaction rate post by post, what the audience did with them, and where the follower count goes.

Views per post

4.6K3 Sep
24
22
4.2K
3.9K4 Sep
4.1K
3.4K
4.3K
4K
4.6K21 Sep
6K
4.8K22 Sep
3.4K
3.7K

Last 14 collected posts, oldest on the left. The scale is logarithmic: one post can outrun the rest a hundred times over.

Engagement rate per post

0.56%3 Sep
0.00%
0.00%
0.53%
0.28%4 Sep
0.44%
0.53%
0.35%
0.30%
0.56%21 Sep
0.53%
0.54%22 Sep
0.44%
0.71%

Reactions — likes, reposts, replies and quotes — divided by views. Median for 100K–1M accounts is 0.93%.

What the audience does

Likes50.2%206 in total
Reposts27.8%114 in total
Replies4.6%19 in total
Quotes2.4%10 in total
Bookmarks14.9%61 in total

Share of every reaction we collected for this account. Replies mean argument, reposts mean endorsement, bookmarks mean the post was worth keeping.

The follower curve appears once this account has two daily snapshots — we take one a day, and this one is on its first.

Contas semelhantes