tweetindex
TH

Ty Beal ✓

@TyBealPhD · Phoenix, AZ · joined 14 Sep 2017

Nutrition Scientist

1 031 884Followers
434Following
7 013Posts total
400.3KViews on collected posts

โพสต์ล่าสุด

Nice feature of our recent article. From Farm to Plate, Indonesian Foods Vary 211-Fold in Nutrition-Environment Efficiency https://t.co/wkpdLMHyvD 11.9K views · 129 likes · 5 reposts · 1 replies Open on X →
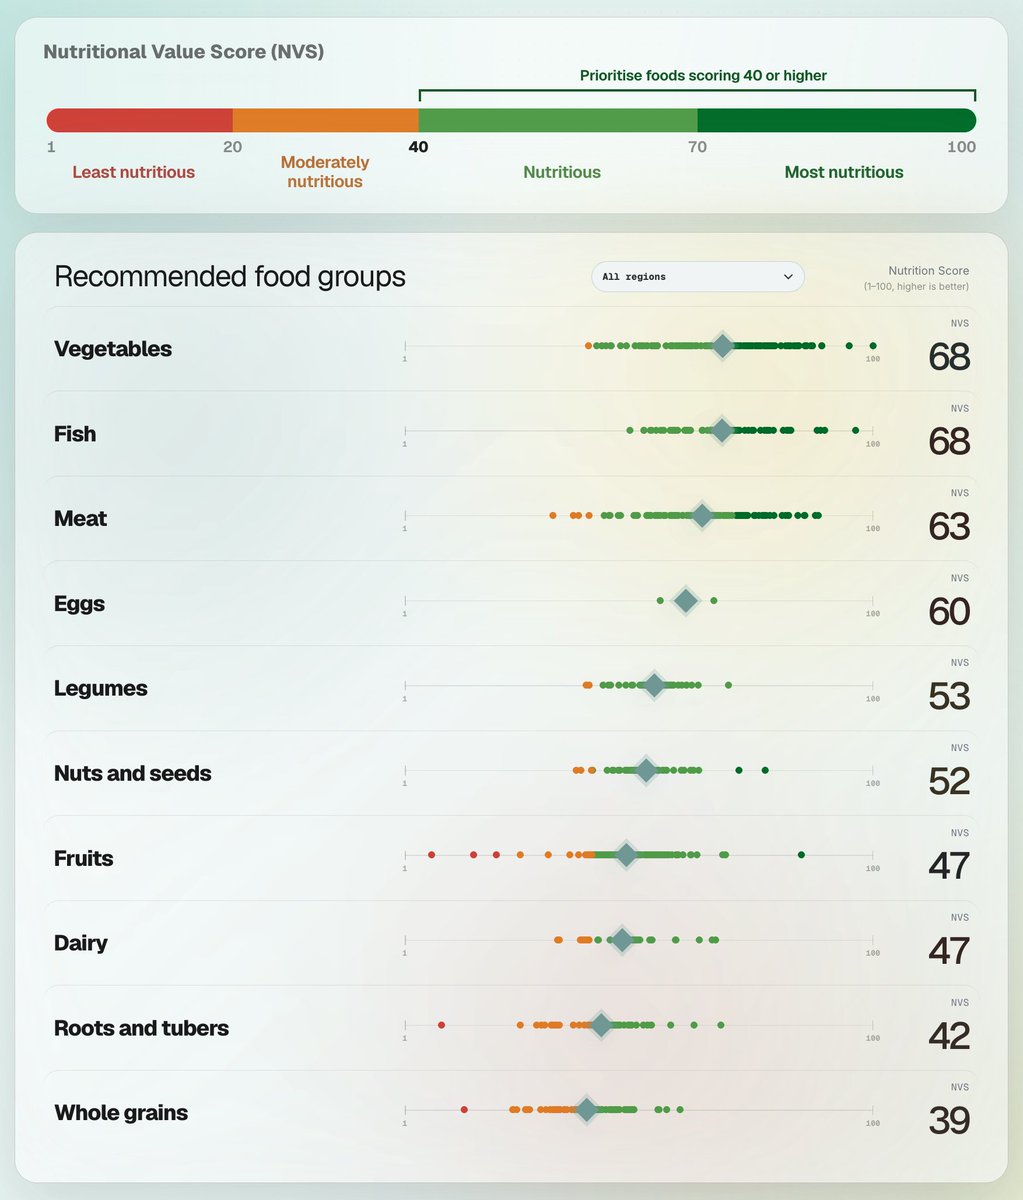
Which foods pack the most nutritional value? Even within the same food group, the differences are striking. Explore the Priority List to see how your favorite foods score on the Nutritional Value Score (NVS). Any surprises? https://t.co/R1TqJmkD7M https://t.co/5jgfDX0HRg
Chart of Nutritional Value Scores (NVS) by food group. Dots show individual foods; diamonds mark group averages: vegetables 68, fish 68, meat 63, eggs 60, legumes 53, nuts and seeds 52, fruits 47, dairy 47, roots and tubers 42, and whole grains 39. Scores vary widely within most groups. A color scale runs from red (least nutritious) to dark green (most nutritious), with foods scoring 40 or higher recommended for prioritization.
7.5K views · 106 likes · 7 reposts · 1 replies Open on X →
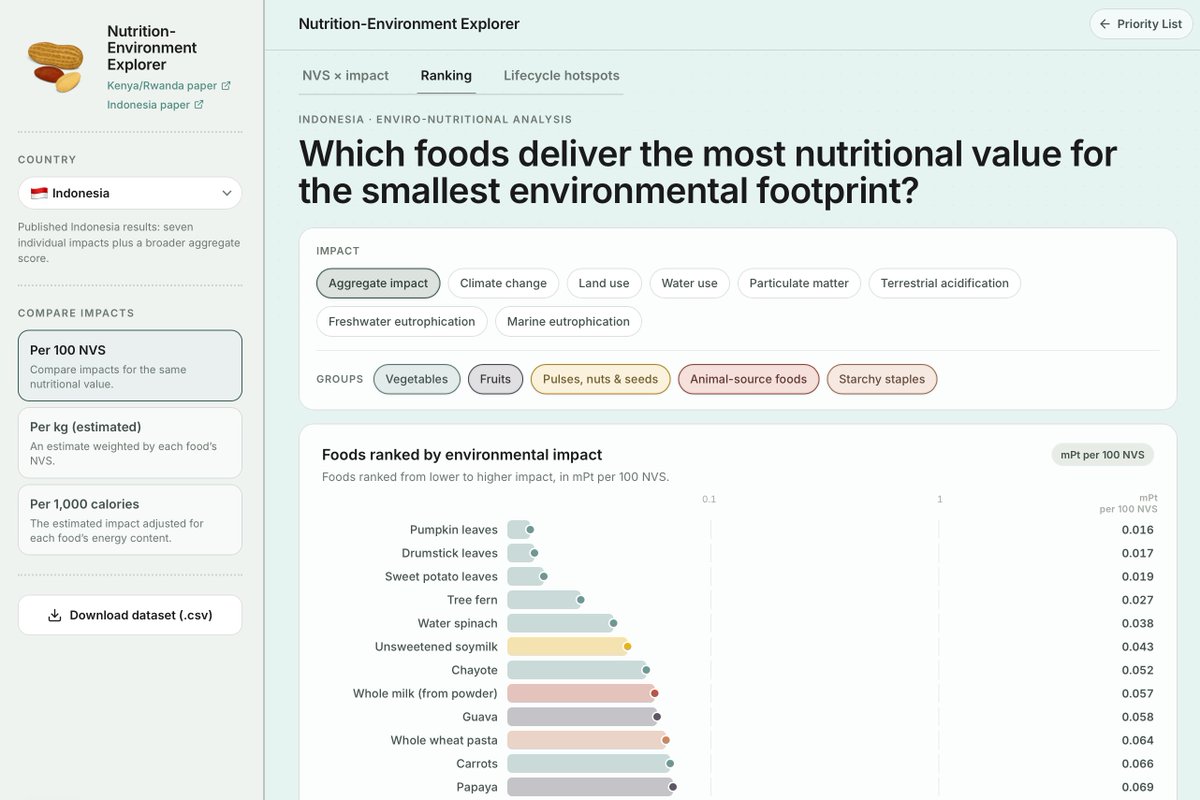
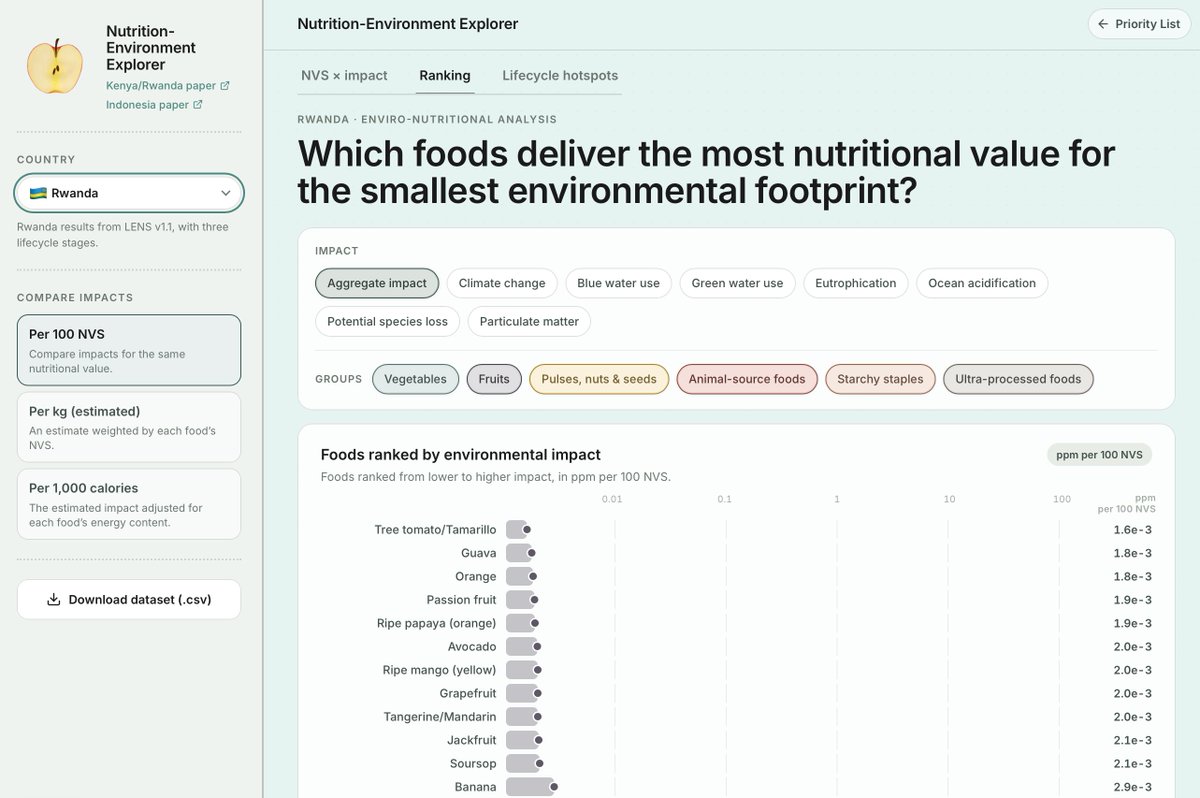
Which foods have the lowest environmental impact for the same nutritional value? Vegetables in Indonesia. Fish in Kenya. Fruit in Rwanda. A clear reminder that there is no one-size-fits-all approach to sustainable diets. The lowest-impact foods for a given nutritional value can
11.8K views · 129 likes · 1 reposts · 1 replies Open on X →
Our new study assessed the nutritional value and environmental impacts of 90 foods consumed in Indonesia. We found large differences within food groups, with promising options including dark green leafy vegetables, milk and yogurt, chicken organs, whole grains, soy products, and
Heatmap comparing nutritional value and seven environmental impacts per unit of nutritional value for 90 foods consumed in Indonesia. Five panels show animal-source foods; pulses, nuts, and seeds; vegetables; starchy staples; and fruits. Green indicates higher nutritional value or lower environmental impact; red indicates the reverse. Results vary widely within food groups. Dark green leafy vegetables, soy products, milk, and yogurt generally have lower environmental impacts per unit of nutritional value than other foods in their groups.
13.9K views · 102 likes · 9 reposts · 6 replies Open on X →
I'm contributing to FedWell, an expert-verified knowledge base for metabolic health. Every claim is published verbatim under the contributor's name, graded by evidence level, with the full reasoning dialogue public. Here's one of mine: Around the world, most people don't get http
13.9K views · 18 likes · 4 reposts · 1 replies Open on X →
Check out the new Country Profiles on the Food Systems Dashboard 👇 https://t.co/7wrJUdGCFE https://t.co/evm5TJFBLj
0:39
32.4K views · 30 likes · 4 reposts · 0 replies Open on X →
@TyBealPhD I feel like @maxlugavere influenced this one.... How'd we finally get meat so high?! 135 views · 3 likes · 0 reposts · 0 replies Open on X →
Check out my blog on the tool here 👇 https://t.co/Rnq0DlUdzv 13.7K views · 16 likes · 0 reposts · 2 replies Open on X →
https://t.co/s9Tjj2p9ht 2.1K views · 4 likes · 0 reposts · 0 replies Open on X →
🔥 Out now! The Priority List, based on the Nutritional Value Score (NVS), shows you which foods are the most nutritious. Fish, non-starchy vegetables, and meat top the list. Now with 778 unique foods to choose from. Check it out 👇 https://t.co/YUeCu64coJ
Screenshot of the Nutritional Value Score (NVS) tool comparing recommended food groups across all regions. Median scores are highest for fish (67), followed by vegetables (63), meat (61), eggs (57), nuts and seeds (49), legumes (45), dairy (42), fruits (39), roots and tubers (33), and whole grains (29). Individual foods within each group are plotted across the 1–100 scale, showing substantial variation within several food groups.
Screenshot of the Nutritional Value Score (NVS) tool showing canned anchovy, sardine, and salmon from sub-Saharan Africa. The food scores 73 out of 100 and is classified as “Most nutritious” on a color-coded scale ranging from least to most nutritious.
37.7K views · 42 likes · 9 reposts · 6 replies Open on X →
Most countries are a long way from meeting food system goals, including the commitment to ensure that no one goes hungry. The green bars indicate countries that are on target, while all other bars indicate varying degrees of shortfall. We urgently need investment and https://t.
Stacked bar chart showing the progress of approximately 200 countries across 33 food system indicators grouped into diets, nutrition and health; environment, natural resources and production; livelihoods, poverty and equity; governance; and resilience. Bars classify countries as on target, making moderate or marginal progress, stagnating, regressing, or lacking sufficient data. Across most indicators, relatively few countries are on target, while stagnation, regression, and insufficient data are widespread.
10.3K views · 14 likes · 4 reposts · 1 replies Open on X →
🔥 It's out! We rated 289 foods by nutritional value—here's what we found 👇 Nutrient-dense foods like fish, meat, and non-starchy vegetables top the list. https://t.co/irBLzsMN50
A horizontal bar chart ranking 43 single foods by their "Nutritional Value Score" on a scale of 0 to 100. Foods are color-coded into six categories: Fruits, Vegetables, Pulses, nuts, and seeds, Animal-source foods, Starchy staples, and Ultra-processed foods. The highest-scoring foods are predominantly vegetables and animal-source foods, led by Dried okra (100), Dried small fish (95), Spinach (93), Chicken organs (86), and Sardines (82). Mid-range foods include Edamame (65), Beef (59), Tofu (55), and Whole cow milk (51). The lowest-scoring foods are largely ultra-processed foods and starchy staples, concluding with White rice (23), Saltine crackers (16), Fufu (16), Sugar cookies (14), Congee (5), and Gatorade (1).
245K views · 972 likes · 183 reposts · 216 replies Open on X →

เทียบกับบัญชีขนาดเดียวกัน

11 โพสต์จาก 90 วันที่ผ่านมา เทียบกับช่วง 1M–10M ผู้ติดตาม แสดงในวงกว้าง แต่มีผู้ชมตอบสนองน้อย.

ยอดดูมัธยฐาน11 880บัญชีนี้14 648ค่ามัธยฐานของ 1M–10M
การเข้าถึง, %1.15%บัญชีนี้0.74%ค่ามัธยฐานของ 1M–10M
การมีส่วนร่วม, %0.19%บัญชีนี้0.70%ค่ามัธยฐานของ 1M–10M
ตัวชี้วัดบัญชีนี้ค่ามัธยฐานของ 1M–10Mอัตราส่วน
ยอดดูมัธยฐานต่อโพสต์11 88014 6480.81×
การเข้าถึง (ยอดดู ÷ ผู้ติดตาม)1.15%0.74%1.56×
อัตราการมีส่วนร่วม0.19%0.70%0.27×

บัญชีอื่นในช่วงนี้ →   เปรียบเทียบกับบัญชีอื่น →   ค่าอ้างอิงเหล่านี้คำนวณอย่างไร →

Growth & engagement

How the posts we collected actually performed: views and reaction rate post by post, what the audience did with them, and where the follower count goes.

Views per post

245K24 Mar
10.3K10 Aug
37.7K17 Aug
2.1K
13.7K
13518 Aug
32.4K
13.9K25 Aug
13.9K9 Sep
11.8K15 Sep
7.5K16 Sep
11.9K23 Sep

Last 12 collected posts, oldest on the left. The scale is logarithmic: one post can outrun the rest a hundred times over.

Engagement rate per post

0.56%24 Mar
0.18%10 Aug
0.16%17 Aug
0.19%
0.14%
2.22%18 Aug
0.11%
0.17%25 Aug
0.84%9 Sep
1.11%15 Sep
1.54%16 Sep
1.14%23 Sep

Reactions — likes, reposts, replies and quotes — divided by views. Median for 1M–10M accounts is 0.70%.

What the audience does

Likes51.4%1 565 in total
Reposts7.4%226 in total
Replies7.7%235 in total
Quotes0.2%7 in total
Bookmarks33.2%1 010 in total

Share of every reaction we collected for this account. Replies mean argument, reposts mean endorsement, bookmarks mean the post was worth keeping.

The follower curve appears once this account has two daily snapshots — we take one a day, and this one is on its first.

บัญชีที่คล้ายกัน