tweetindex
TH

Visual Capitalist ✓

@VisualCap · Vancouver, BC · joined 10 Aug 2011

Data-driven visual content focused on global trends, investing, technology, and the economy. 📲 Creator on @VoronoiApp

360 817Followers
3 302Following
17 350Posts total
95.3KViews on collected posts

โพสต์ล่าสุด

Ranked: Real Estate Returns Across 57 Countries Since 2008 🏠  This graphic by Valerii Emelianov is one of the many incredible data-driven charts and stories from creators featured on our website. ✅ https://t.co/9iwSaE6lJC https://t.co/q1plVInS3Q
2.9K views · 3 likes · 1 reposts · 4 replies Open on X →
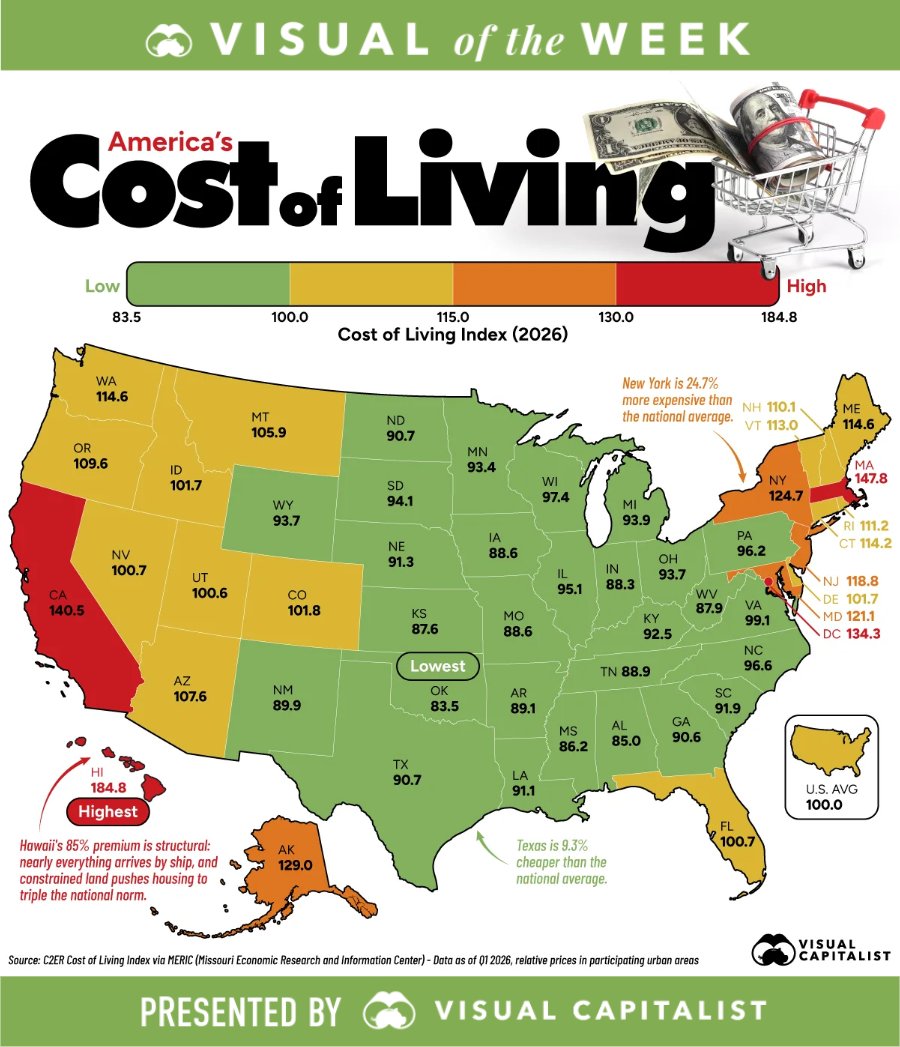
Visual of the Week 🥇 Hawaii is America’s most expensive state, with living costs 84.8% above the national average, while Oklahoma is the cheapest at 16.5% below. https://t.co/qYFWozrVek https://t.co/Qg8Z9cy3hY
7K views · 62 likes · 11 reposts · 2 replies Open on X →
Salt has been essential for 5,000 years and remains central to modern life 🧂 Created in partnership with @AtlasSalt, this graphic visualizes the 5,000-year history of salt and how its role has evolved across trade, industry, public health, and infrastructure. https://t.co/cD6oh5
7.2K views · 45 likes · 11 reposts · 2 replies Open on X →
Mapped: The U.S. States Hit Hardest by Canada’s Tariffs 🇨🇦  https://t.co/HcldcdPIkq https://t.co/2eTNqeCVpv
9.9K views · 35 likes · 17 reposts · 6 replies Open on X →
Charted: How Europe Generates Its Electricity ⚡  https://t.co/y7N4gruF3e https://t.co/ylBv5WaU64
9.2K views · 66 likes · 12 reposts · 6 replies Open on X →
America’s Most-Spoken Languages Besides English (1980-2024) 🗣️  This graphic by @JuliePeasley is one of the many incredible data-driven charts and stories from creators featured on our @VoronoiApp. ✅ https://t.co/VbxAbcC8Ez https://t.co/GoNzo6oLSy
8.3K views · 50 likes · 10 reposts · 4 replies Open on X →
@VisualCap Emphasis on 'documented' 😉 62 views · 2 likes · 0 reposts · 0 replies Open on X →
@VisualCap This is more a record of serial killers that were caught. 35 views · 2 likes · 0 reposts · 0 replies Open on X →
@VisualCap The US has 3,800 'identified' serial killers because it has the most accessible police records, prison databases, and true crime recording obsession on the planet. Iran at 13 and Turkey at 16 since 1900 are not crime statistics, they're archival statistics. Imagine thi 642 views · 10 likes · 0 reposts · 2 replies Open on X →
Ranked: Countries With the Most Serial Killers 🔪  https://t.co/Ck9OAeLA1j https://t.co/ll0Ij7gRIB
12.9K views · 113 likes · 22 reposts · 13 replies Open on X →
The 13 biggest U.S. football stadiums are all home to college teams 🏟️ Created in partnership with @TerzoHQ, this graphic ranks the biggest U.S. football stadiums by capacity and shows how college venues compare with the NFL. https://t.co/uHNVAMDkaq #ter02 https://t.co/i7vF3jCj
0:30
8.9K views · 31 likes · 4 reposts · 1 replies Open on X →
@VisualCap Canada's household debt is insane! 203 views · 0 likes · 0 reposts · 0 replies Open on X →
@VisualCap Debt-to-GDP is a stock. Growth is a flow. A high ratio can sit on a slow economy for decades (Japan). A fast-growing large economy can look “better” on the ratio while the debt pile still rises. 306 views · 1 likes · 0 reposts · 0 replies Open on X →
@VisualCap 🇧🇷The correct figures for Brazil, based on data from the Central Bank of Brazil (BCB): Government: 82.5% (R$ 10.9 tri) Households: 37.5% (R$ 5.0 tri) Companies: 54.4% (R$ 7.2 tri) Source: Central Bank of Brazil (BCB), July 2026 note: The IMF uses a methodology that 415 views · 4 likes · 0 reposts · 0 replies Open on X →
Ranked: Countries With the Highest Debt-to-GDP Ratios 💳  https://t.co/pY7EGF3Jga https://t.co/5IOiMxqwoU
17.4K views · 171 likes · 32 reposts · 6 replies Open on X →
Ranked: The Most Followed People on Instagram in 2026 📱 https://t.co/Dktu1aZvU1 https://t.co/fNsVya6yip
9.9K views · 29 likes · 5 reposts · 5 replies Open on X →

เทียบกับบัญชีขนาดเดียวกัน

16 โพสต์จาก 90 วันที่ผ่านมา เทียบกับช่วง 100K–1M ผู้ติดตาม แสดงต่อคนมากกว่าบัญชีขนาดเดียวกัน.

ยอดดูมัธยฐาน7 114บัญชีนี้5 983ค่ามัธยฐานของ 100K–1M
การเข้าถึง, %1.97%บัญชีนี้1.49%ค่ามัธยฐานของ 100K–1M
การมีส่วนร่วม, %0.86%บัญชีนี้0.93%ค่ามัธยฐานของ 100K–1M
ตัวชี้วัดบัญชีนี้ค่ามัธยฐานของ 100K–1Mอัตราส่วน
ยอดดูมัธยฐานต่อโพสต์7 1145 9831.19×
การเข้าถึง (ยอดดู ÷ ผู้ติดตาม)1.97%1.49%1.32×
อัตราการมีส่วนร่วม0.86%0.93%0.92×

บัญชีอื่นในช่วงนี้ →   เปรียบเทียบกับบัญชีอื่น →   ค่าอ้างอิงเหล่านี้คำนวณอย่างไร →

Growth & engagement

How the posts we collected actually performed: views and reaction rate post by post, what the audience did with them, and where the follower count goes.

Views per post

4158 Sep
306
203
8.9K
12.9K9 Sep
642
35
62
8.3K
9.2K11 Sep
9.9K
7.2K
7K12 Sep
2.9K

Last 14 collected posts, oldest on the left. The scale is logarithmic: one post can outrun the rest a hundred times over.

Engagement rate per post

0.96%8 Sep
0.33%
0.00%
0.42%
1.22%9 Sep
1.87%
5.71%
3.23%
0.77%
0.91%11 Sep
0.59%
0.81%
1.07%12 Sep
0.28%

Reactions — likes, reposts, replies and quotes — divided by views. Median for 100K–1M accounts is 0.93%.

What the audience does

Likes61.5%624 in total
Reposts12.3%125 in total
Replies5.0%51 in total
Quotes2.1%21 in total
Bookmarks19.1%194 in total

Share of every reaction we collected for this account. Replies mean argument, reposts mean endorsement, bookmarks mean the post was worth keeping.

The follower curve appears once this account has two daily snapshots — we take one a day, and this one is on its first.

บัญชีที่คล้ายกัน