tweetindex
TH

Alex Krüger

@krugermacro · Kairos · joined 23 Mar 2012

🇦🇷 Economist. Trader. Advisory. Sharing views on global markets.

216 736Followers
1 706Following
48 523Posts total
2.7MViews on collected posts

โพสต์ล่าสุด

Don't be a doomer. The choice is yours. 11.3K views · 77 likes · 2 reposts · 4 replies Open on X →
The choice is yours https://t.co/ZCdkfmqeBn
19.3K views · 235 likes · 10 reposts · 8 replies Open on X →
@krugermacro What you mean hot? Do you know how to read the numbers? 278 views · 3 likes · 0 reposts · 0 replies Open on X →
This is insane. The price of the RAM I bought in February is now 2x higher. SSDs are up 75%. 11.2K views · 75 likes · 0 reposts · 5 replies Open on X →
The market is telling us that bringing long rates lower (or more accurately, keeping them from rising too rapidly) is the key for the party to go on. 14.6K views · 187 likes · 8 reposts · 9 replies Open on X →
@krugermacro not really hot when you dig in.. 1K views · 5 likes · 0 reposts · 0 replies Open on X →
@krugermacro nah, mostly oil related. Everything else was cool. 431 views · 2 likes · 0 reposts · 0 replies Open on X →
Core CPI came in hot. Fed hike odds are up (85% priced in by now). Curve flattening: long bonds liking the upcoming hike. Warsh will hike next week. He will deliver what the market expects, and build up reputational cache. 27K views · 237 likes · 6 reposts · 24 replies Open on X →
@LynAldenContact If you enjoyed this thread please retweet the first tweet of the thread, and follow @asgardmarkets and @krugermacro for more, as well as my partners @ranfossi and @MacroNacho. Thank you for reading! https://t.co/FSgK7mLLt4 16.4K views · 62 likes · 7 reposts · 9 replies Open on X →
@LynAldenContact You may find the full research report at https://t.co/XP29cUaOU0 Please subscribe and stay tuned for our upcoming in-depth coverage of yield curve dynamics in developed and emerging markets. https://t.co/WtkkCNsoLZ 16.8K views · 62 likes · 3 reposts · 3 replies Open on X →
@LynAldenContact 31/ What could go wrong? The market is estimating a 25% to 35% probability of recession in the US. A market crash would require an information shock, such as significant deviations in inflation, PMIs, adverse geopolitical developments, or a dismal earnings seaso 11.7K views · 75 likes · 4 reposts · 5 replies Open on X →
@LynAldenContact 30/TL;DR Everyone is bearish. But the recession has been front-run, AI revolution is real, the Fed is almost done, and the market is cash heavy. We see no reason for changing our bullish stance, which we've held for all of 2023. The trend is your friend. And th 80.2K views · 472 likes · 66 reposts · 7 replies Open on X →
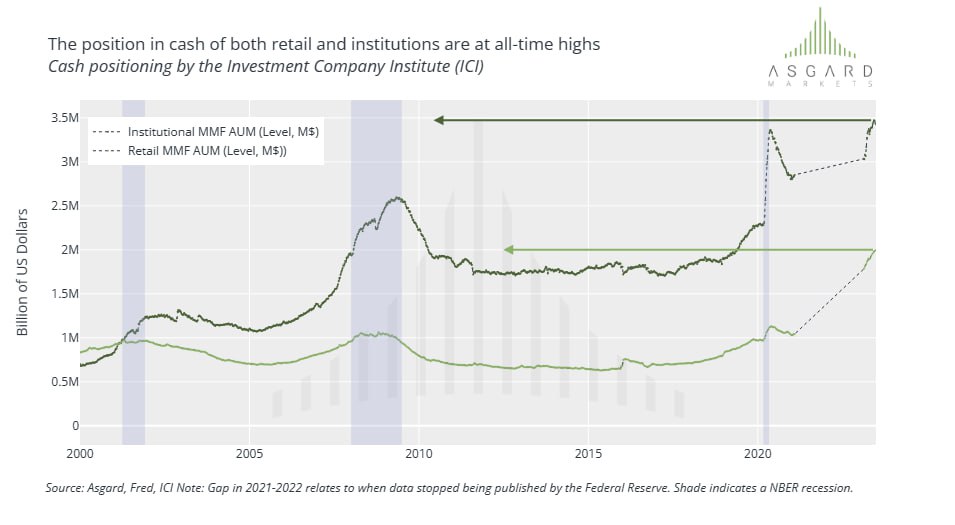
@LynAldenContact 29/ Sixth: Positioning is Cash Heavy According to the ICI, money market funds hit a record $5.4 trillion, while institutions hold $3.4 trillion as of June 28th, roughly 2% above the prior highest level on record, which happened in May 2020, the darkest point of
19.5K views · 95 likes · 6 reposts · 3 replies Open on X →
@krugermacro Good luck on the new venture Alex. 13.6K views · 35 likes · 0 reposts · 2 replies Open on X →
@LynAldenContact 28/ The tightening cycle is thus likely 90% done, with the Fed talking about two more hikes ahead. Given 20 hikes already behind us, what difference would it make if the Fed were to raise three more times instead of two? The answer is simple: likely not that mu
16.2K views · 86 likes · 5 reposts · 4 replies Open on X →
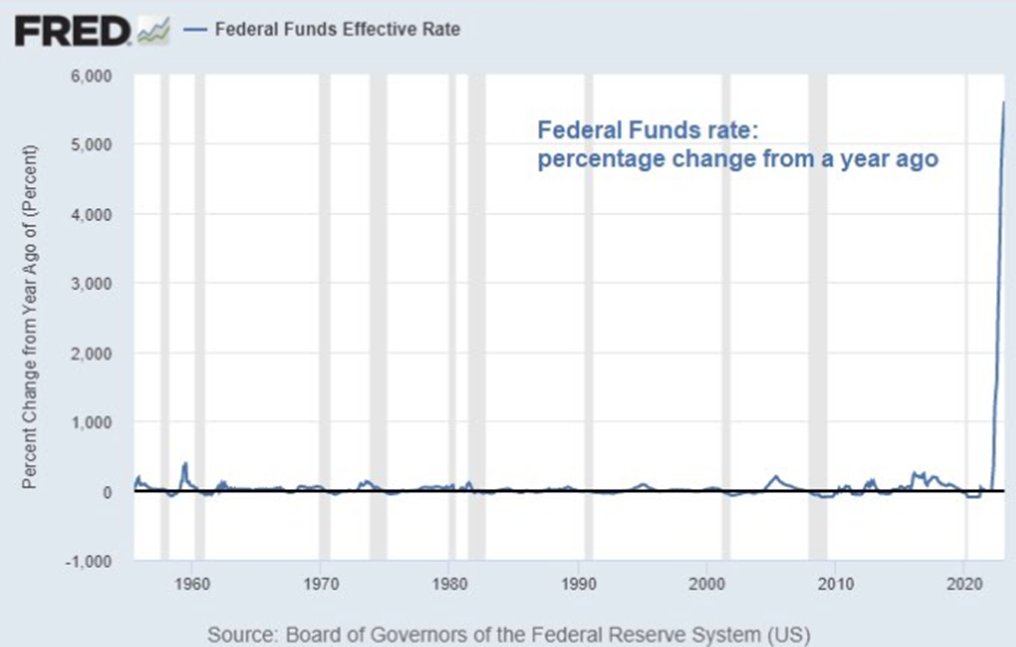
27/ Fourth: The Fed Is almost finished hiking. The main reason for risk assets to crash in 2022 was the Fed's tightening cycle. The Fed has delivered 20 x 25bps rate hikes in its fastest and most aggressive hiking cycle in history. Credit to @LynAldenContact for the chart. http
17.1K views · 93 likes · 4 reposts · 3 replies Open on X →
26/ Furthermore, much of the TGA refill comes from market funds rotating holdings away from the Fed’s overnight reverse repurchase facility, having therefore no impact on net liquidity. https://t.co/luCNW1SFes
16.7K views · 54 likes · 0 reposts · 5 replies Open on X →
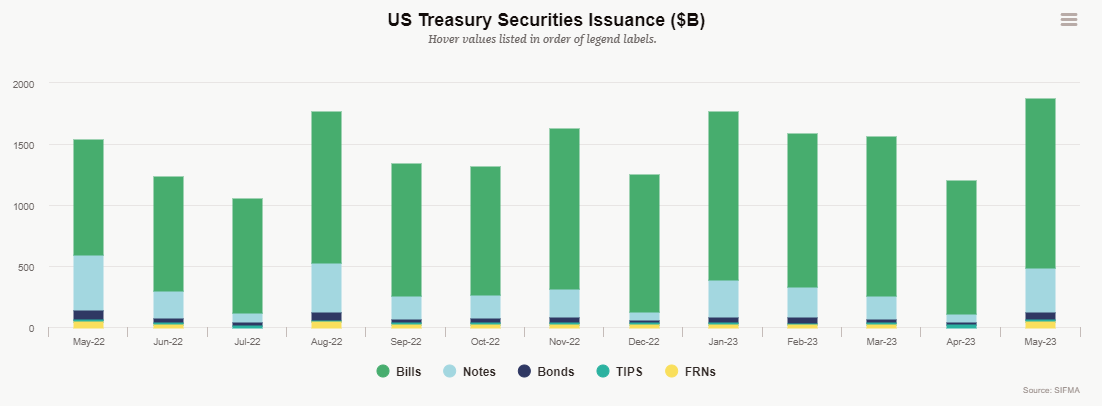
25/ While QT represents an asset swap that increases duration in the market (swapping long for short), TGA replenishing at present simply changes investor allocation from one cash-like instrument to another, as most issuance is in bills (short-term treasuries). https://t.co/0XFlQ
17.6K views · 58 likes · 1 reposts · 1 replies Open on X →
24/ Contrary to popular belief, liquidity is not the main driver of asset prices. It's all about flows, not liquidity. Positioning, rates, liquidity, growth, valuations and expectations are what drive flows. After all, liquidity is a snapshot, while prices are forward looking. h
29.1K views · 128 likes · 10 reposts · 7 replies Open on X →
23/ So, TGA up, risk assets down, right? Wrong. The TGA is known to be decorrelated from risk assets for very long periods of time. In fact, the four largest TGA rebuilds over the last two decades have had a minimal impact on the market. https://t.co/Bl78v9kS9u
17.7K views · 79 likes · 1 reposts · 2 replies Open on X →
22/ Fourth: Liquidity! The market has been placing extreme emphasis on the TGA draining liquidity Many analysts see the Treasury refilling the TGA as a strong headwind for risk assets, akin to QT, whereas the Treasury issues bonds, in exchange for liquidity (cash). 17.4K views · 63 likes · 0 reposts · 1 replies Open on X →
21/ Is an AI bubble forming? Likely so, and it is just getting started! https://t.co/wjkpilXxN3
17K views · 110 likes · 6 reposts · 2 replies Open on X →
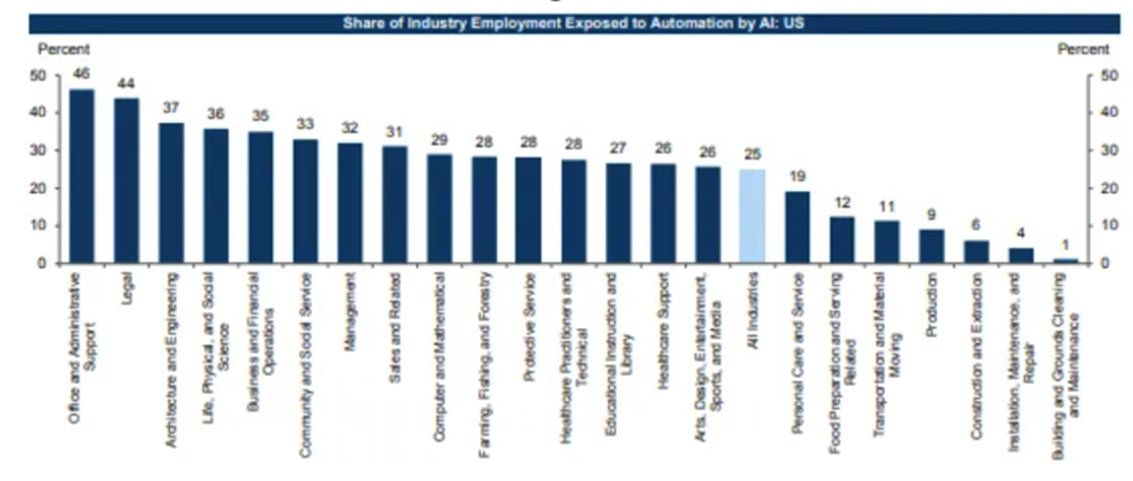
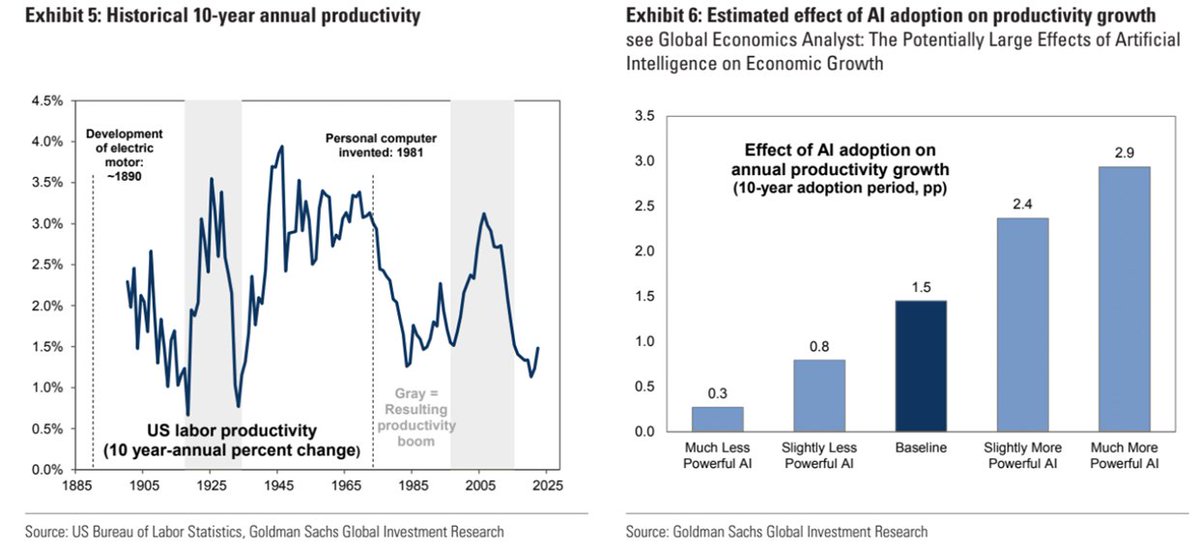
20/ Analysts estimate AI could replace up to 25% of current employment in developed countries, while generative AI could raise annual productivity growth by 1.5 percentage points over 10 years, and this productivity boost could eventually increase annual global GDP by 7%. https:/
23.3K views · 94 likes · 5 reposts · 2 replies Open on X →
19/ Third: markets are forward looking, and the AI revolution Is real. The world is undergoing an AI revolution comparable to the internet evolution or the industrial revolution. Nvidia's earnings have just skyrocketed. https://t.co/c3VADXriGv
17.1K views · 95 likes · 4 reposts · 3 replies Open on X →
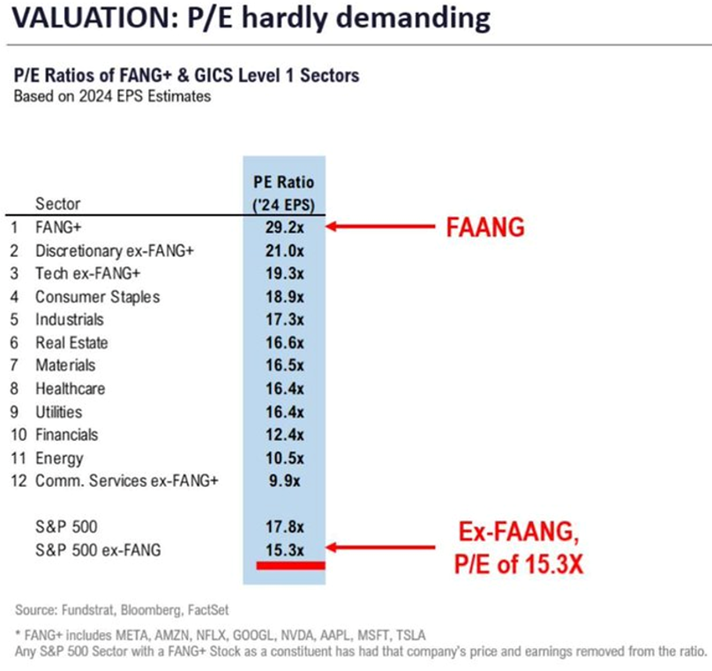
18/ Second: Valuations Are in the Eye of the Beholder Bias in data and timeframe selection can make all the difference. There are metrics that depict fair pricing and merit closer examination, such as forward P/E for the S&P 500 ex FAANG. Thank you @fundstrat for the chart. htt
19.6K views · 89 likes · 2 reposts · 1 replies Open on X →
16/ And that makes sense. After all, markets are pricing mechanisms, and what truly matters is not if data comes in positive or negative, but if data comes in better or worse than what is priced in. 19.3K views · 130 likes · 11 reposts · 1 replies Open on X →
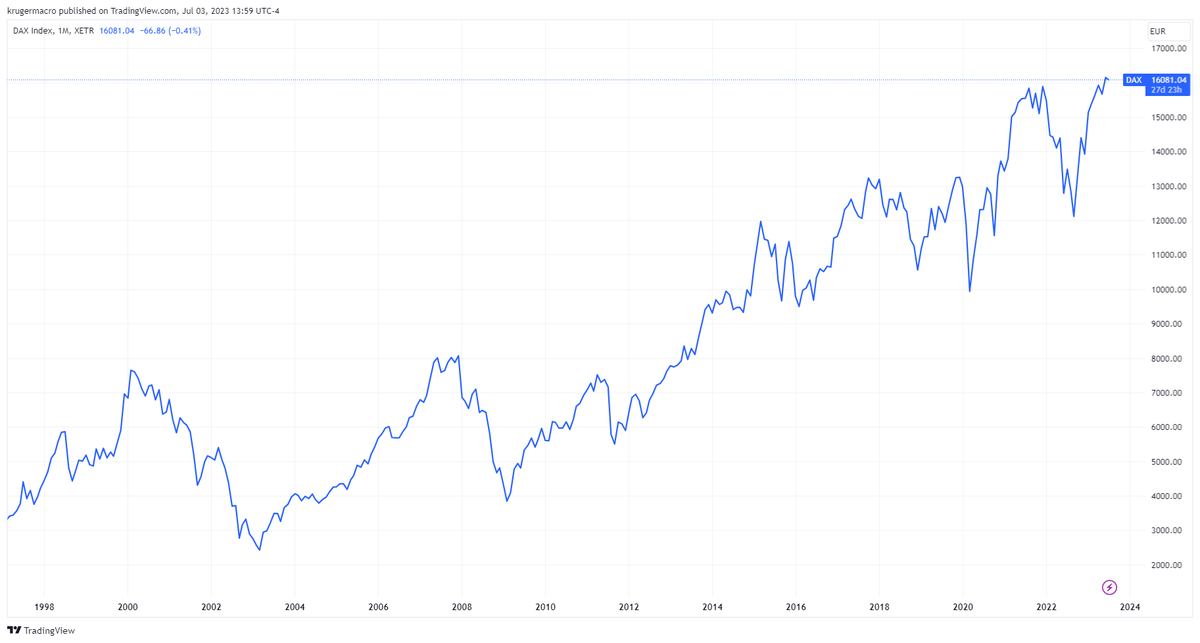
17/ The view that risk assets must bottom if the US enters a recession is also flawed due to the very limited sample size of US recessions. Plenty of counterexamples exist outside of the US. For example the DAX has been printing all time highs while Germany is in recession. http
18.5K views · 100 likes · 2 reposts · 3 replies Open on X →
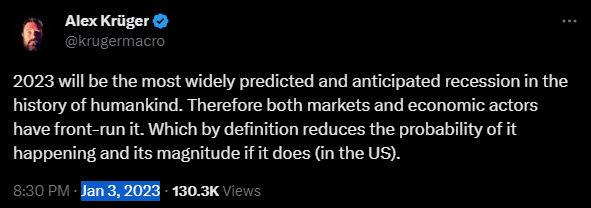
14/ The upcoming recession, if any, has been the most widely predicted recession in the history of civilization. Therefore both markets and economic actors have front-run it. Which by definition reduces the probability of it happening, and its magnitude if it does. https://t.co/n
43K views · 175 likes · 5 reposts · 8 replies Open on X →
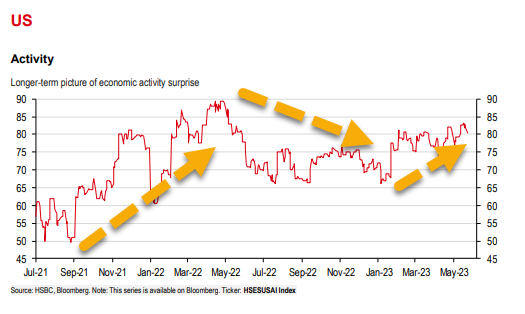
15/ Economists & analysts lowered their forecasts in response, leading to one of the most important drivers of equity performance this year: economic activity consistently surprising to the upside. https://t.co/4Rls6csBeU
19.4K views · 87 likes · 0 reposts · 1 replies Open on X →
13/ Let's explore the other side of the coin, and debunk it all. First: Recessions 👇 21.9K views · 69 likes · 1 reposts · 1 replies Open on X →

เทียบกับบัญชีขนาดเดียวกัน

8 โพสต์จาก 90 วันที่ผ่านมา เทียบกับช่วง 100K–1M ผู้ติดตาม แสดงต่อคนมากกว่าบัญชีขนาดเดียวกัน.

ยอดดูมัธยฐาน11 270บัญชีนี้5 912ค่ามัธยฐานของ 100K–1M
การเข้าถึง, %5.20%บัญชีนี้1.58%ค่ามัธยฐานของ 100K–1M
การมีส่วนร่วม, %0.86%บัญชีนี้1.04%ค่ามัธยฐานของ 100K–1M
ตัวชี้วัดบัญชีนี้ค่ามัธยฐานของ 100K–1Mอัตราส่วน
ยอดดูมัธยฐานต่อโพสต์11 2705 9121.91×
การเข้าถึง (ยอดดู ÷ ผู้ติดตาม)5.20%1.58%3.29×
อัตราการมีส่วนร่วม0.86%1.04%0.83×

บัญชีอื่นในช่วงนี้ →   เปรียบเทียบกับบัญชีอื่น →   ค่าอ้างอิงเหล่านี้คำนวณอย่างไร →

Growth & engagement

How the posts we collected actually performed: views and reaction rate post by post, what the audience did with them, and where the follower count goes.

Views per post

13.6K3 Jul
19.5K
80.2K
11.7K
16.8K
16.4K
27K11 Sep
431
1K
14.6K
11.2K
278
19.3K
11.3K

Last 14 collected posts, oldest on the left. The scale is logarithmic: one post can outrun the rest a hundred times over.

Engagement rate per post

0.27%3 Jul
0.53%
0.68%
0.72%
0.41%
0.48%
0.99%11 Sep
0.46%
0.49%
1.40%
0.71%
1.08%
1.31%
0.73%

Reactions — likes, reposts, replies and quotes — divided by views. Median for 100K–1M accounts is 1.04%.

What the audience does

Likes85.9%3 132 in total
Reposts4.6%169 in total
Replies3.4%124 in total
Bookmarks6.1%223 in total

Share of every reaction we collected for this account. Replies mean argument, reposts mean endorsement, bookmarks mean the post was worth keeping.

The follower curve appears once this account has two daily snapshots — we take one a day, and this one is on its first.

บัญชีที่คล้ายกัน