tweetindex
TR

Urban Cycling Institute 🚲 

@fietsprofessor · Amsterdam · joined 07 Jul 2010

Bringing science on cycling to practice & back | Main contributor Marco te Brömmelstroet | Urban Cycling Institute | MOOC: https://t.co/hIqOuqPwoI

95 644Followers
81Following
15 664Posts total
663KViews on collected posts

Son gönderiler

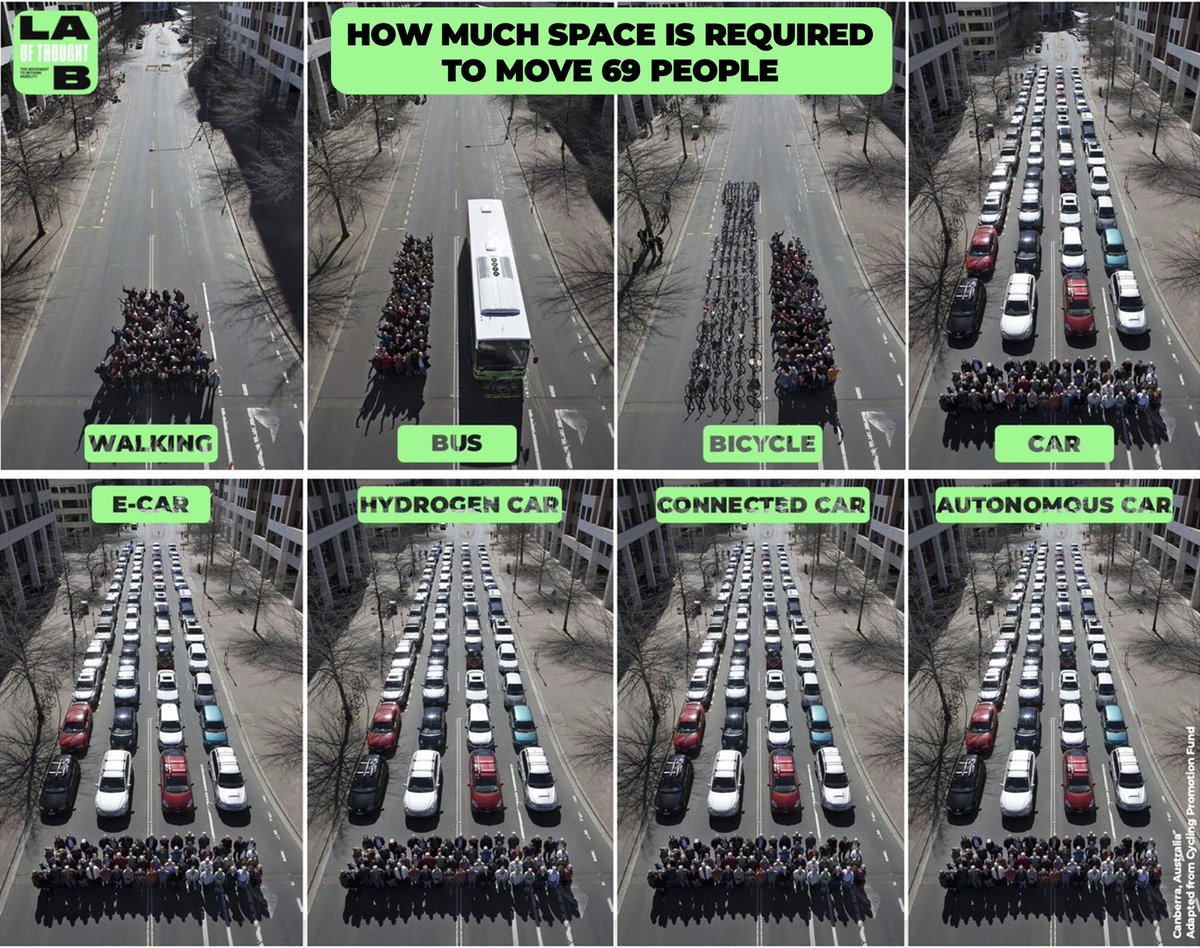
Electric, connected or autonomous cars are not invented to save our cities. They are invented to save the car industry. https://t.co/CH5lGEXbBm
3K views · 96 likes · 46 reposts · 8 replies Open on X →
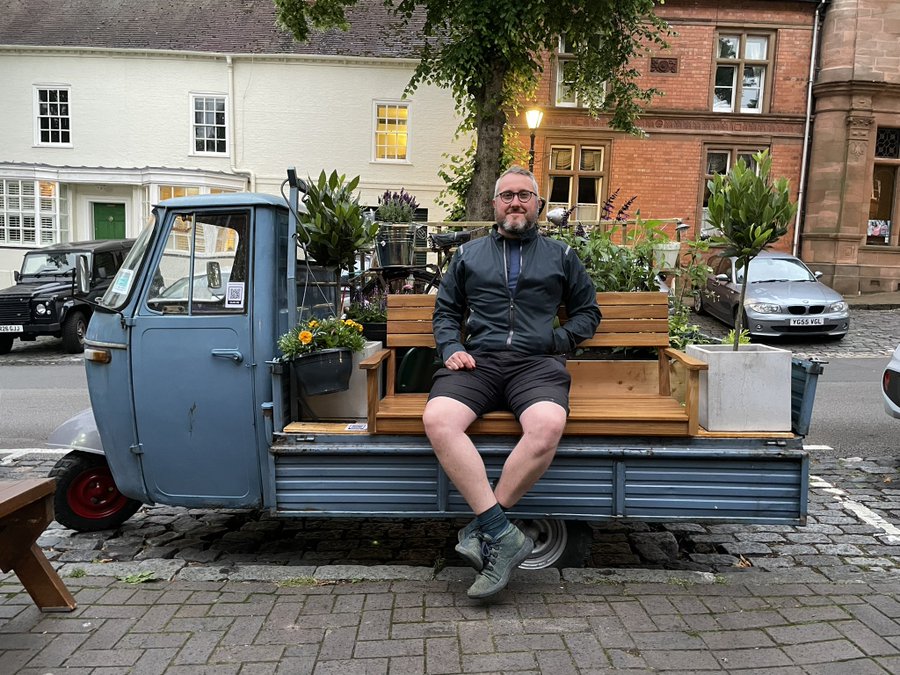
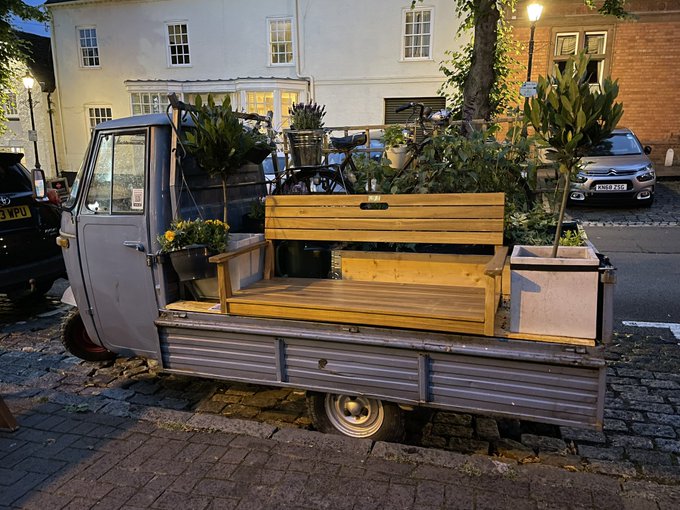
When @adamtranter built a parklet in a car parking space it was removed by the council because it wasn’t a motor vehicle. In response he built a parklet which is a motor vehicle and so the space for the community is back. 💯 Boss level frictioneering https://t.co/cghXALGvFD
5.8K views · 184 likes · 37 reposts · 5 replies Open on X →
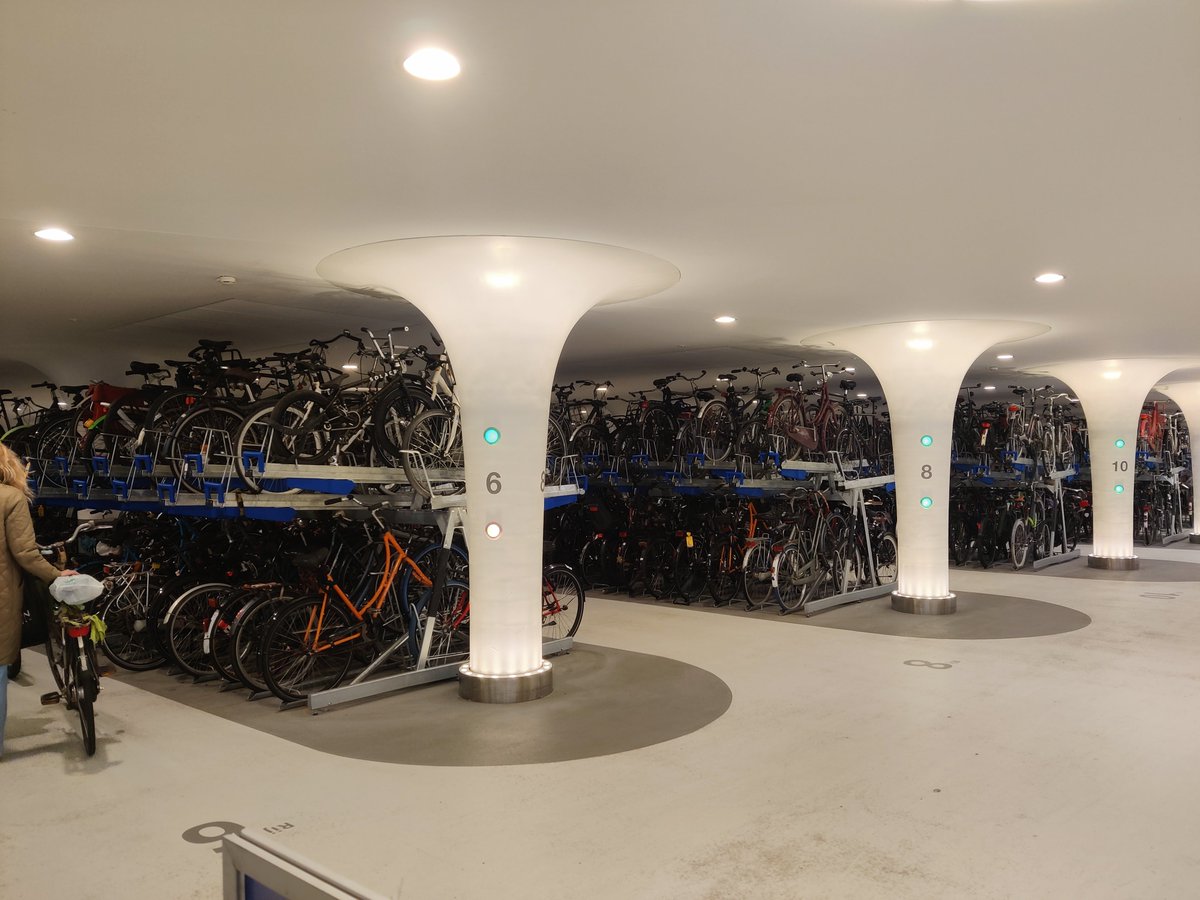
@fietsprofessor I have seen massive and great cycle stand underneath Amsterdam Central station Impressive https://t.co/3TwFnlSVgc
1.1K views · 8 likes · 0 reposts · 0 replies Open on X →
@fietsprofessor Vaguely wondering how big a car park needs to be to serve cars for equivalent passengers to 33k bike spots... Oh. Biggest (public) parking lot in the world only fits 20k cars. (need the overflow to get to comparable number of users given typical car occupancy) 2.3K views · 3 likes · 0 reposts · 0 replies Open on X →
@fietsprofessor The UK should adopt the Dutch model https://t.co/shfsEEcyVN
2.8K views · 6 likes · 1 reposts · 0 replies Open on X →
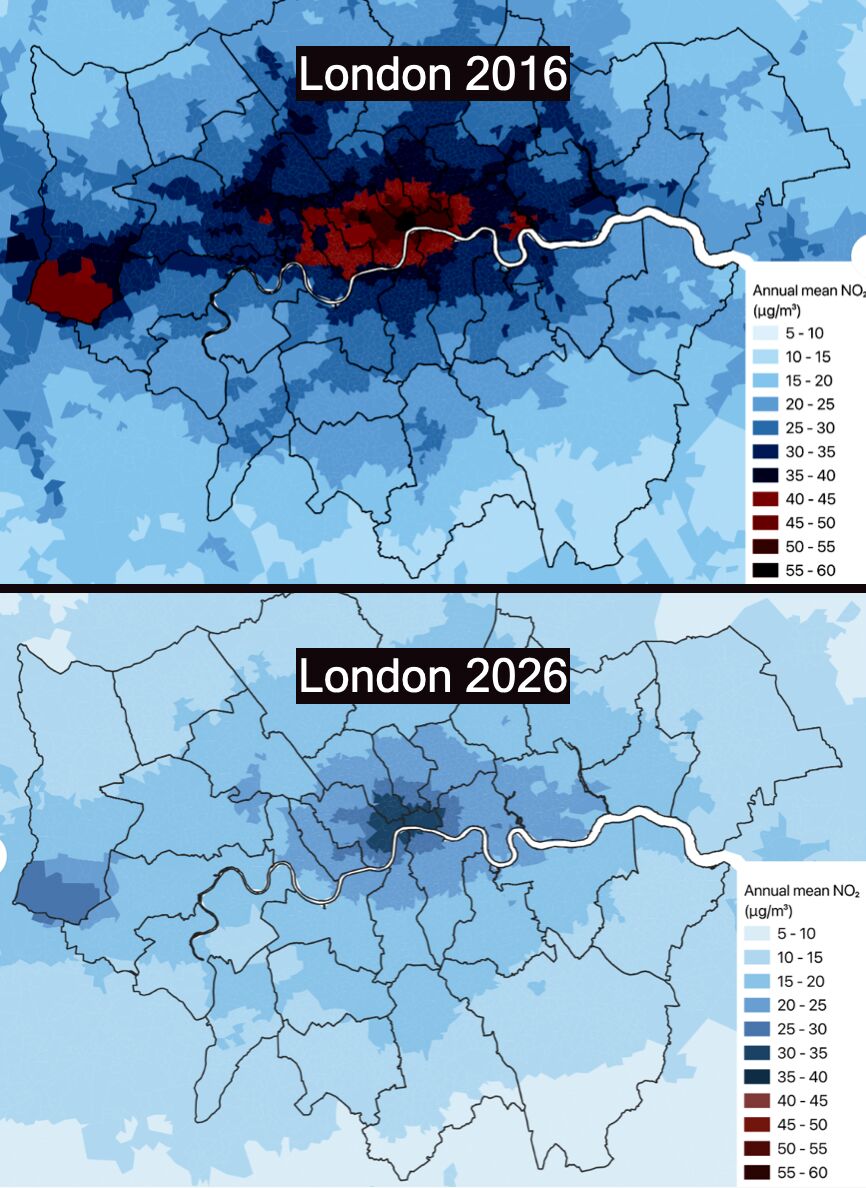
@fietsprofessor Thank you for highlighting London’s success. Please re-issue with a scale based on the @WHO #AirQualityGuidelines updated five years ago (not 2005 AQGs) cc @SadiqKhan @MayorofLondon 6.8K views · 21 likes · 2 reposts · 1 replies Open on X →
The Dutch🇳🇱 don't arrive by bike at the #TrainStation. Instead, they arrive by train at the #BikeStation! 🚆 50% of train travellers arrive by bike. 🚲 33.000 bike parking spots around Utrecht CS. 💰 30 million Euro investment. (📹: @defilmendefietser) https://t.co/jlmn3HPIeT
1:37
232.7K views · 739 likes · 159 reposts · 11 replies Open on X →
@fietsprofessor This difference is so amazing that I hope the @MayorofLondon will be elected for a fifth and sixth and even seventh term if he likes. He did so much good. It needs to go on. He changed London for the better. 972 views · 11 likes · 0 reposts · 0 replies Open on X →
@fietsprofessor Incorrect, its not due to traffic calming but technology advances in cars. Diesel cars of today vs diesel cars of 20 years ago have dropped 80-90% in Nox emissions. Add to that the change to electric cars and you see the same drops in other cities. So its a false 1.2K views · 14 likes · 1 reposts · 3 replies Open on X →
LONDON🇬🇧 is the next major city that shows how reducing car traffic delivers real, measurable public-health gains. AFTER #ULEZ zone: 📉 NO₂ down by 38% 🏥 Fewer hospital admissions ☠️ An estimated 40% fall in deaths linked to air pollution 🧒 Kids health shows recovery https://t.co
345.2K views · 1.2K likes · 291 reposts · 37 replies Open on X →
How zebra crossings should work if we would actually take pedestrian safety seriously. https://t.co/9rDOOaDd9S
0:58
12.4K views · 391 likes · 89 reposts · 12 replies Open on X →
@fietsprofessor Yeah, that’s why the legacy car industry is slowly dying from EV adoption. Retards. 🙄 20 views · 3 likes · 0 reposts · 1 replies Open on X →
@fietsprofessor Ok but we need cars to get around to the places we've created already 323 views · 4 likes · 0 reposts · 0 replies Open on X →
@fietsprofessor True, but still better to drive EV than ICE cars. 459 views · 6 likes · 0 reposts · 1 replies Open on X →
Electric cars were not invented to save the planet, our lives or our cities. They were only invented to save the car industry. (🖼️ by Antonio Huerta) https://t.co/aMRvueOUAf
47.8K views · 1.1K likes · 228 reposts · 45 replies Open on X →

Aynı büyüklükteki hesaplara karşı

Son 90 güne ait 15 gönderi, 10K–100K takipçi aralığıyla yan yana. takipçi aralığının tam medyanında.

Medyan görüntülenme2 830bu hesap99310K–100K için medyan
Erişim, %2.96%bu hesap3.67%10K–100K için medyan
Etkileşim, %1.24%bu hesap1.61%10K–100K için medyan
ÖlçütBu hesap10K–100K için medyanOran
Gönderi başına medyan görüntülenme2 8309932.85×
Erişim (görüntülenme ÷ takipçi)2.96%3.67%0.81×
Etkileşim oranı1.24%1.61%0.77×

Bu aralıktaki diğer hesaplar →   Başka bir hesapla karşılaştır →   Bu kıyas değerleri nasıl kuruluyor →

Growth & engagement

How the posts we collected actually performed: views and reaction rate post by post, what the audience did with them, and where the follower count goes.

Views per post

4599 Jul
323
2010 Jul
12.4K8 Sep
345.2K9 Sep
1.2K
972
232.7K10 Sep
6.8K
2.8K11 Sep
2.3K
1.1K12 Sep
5.8K
3K13 Sep

Last 14 collected posts, oldest on the left. The scale is logarithmic: one post can outrun the rest a hundred times over.

Engagement rate per post

1.53%9 Jul
1.24%
20.00%10 Jul
3.97%8 Sep
0.43%9 Sep
1.46%
1.13%
0.39%10 Sep
0.35%
0.25%11 Sep
0.13%
0.71%12 Sep
3.91%
5.03%13 Sep

Reactions — likes, reposts, replies and quotes — divided by views. Median for 10K–100K accounts is 1.61%.

What the audience does

Likes74.2%3 727 in total
Reposts17.0%854 in total
Replies2.5%124 in total
Quotes0.4%18 in total
Bookmarks6.0%300 in total

Share of every reaction we collected for this account. Replies mean argument, reposts mean endorsement, bookmarks mean the post was worth keeping.

Followers by day

13 Sep

Daily snapshots since 13 Sep 2026; the dashed line is the starting count.

Benzer hesaplar