tweetindex
TR

Nick Gerli

@nickgerli1 · Nashville, TN · joined 04 Sep 2018

CEO of Reventure App. Home price forecasts and fair value for every U.S. ZIP code.

156 892Followers
309Following
10 947Posts total
1.4MViews on collected posts

Son gönderiler

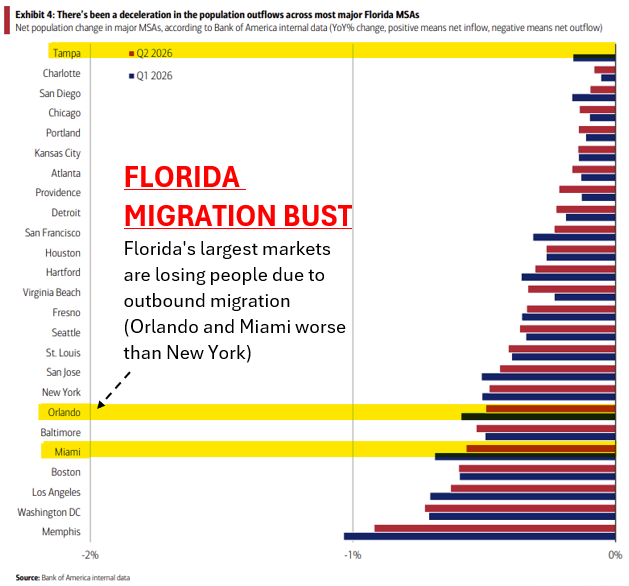
11) We don't know exact 2026 data yet from the Census Bureau. They'll release that in March 2027. However, this Bank of America report provides a clue. Tampa, Orlando, and Miami still being negative on migration in Q2 2026 suggests the losses/slowdown is still happening. And 11.2K views · 39 likes · 1 reposts · 5 replies Open on X →
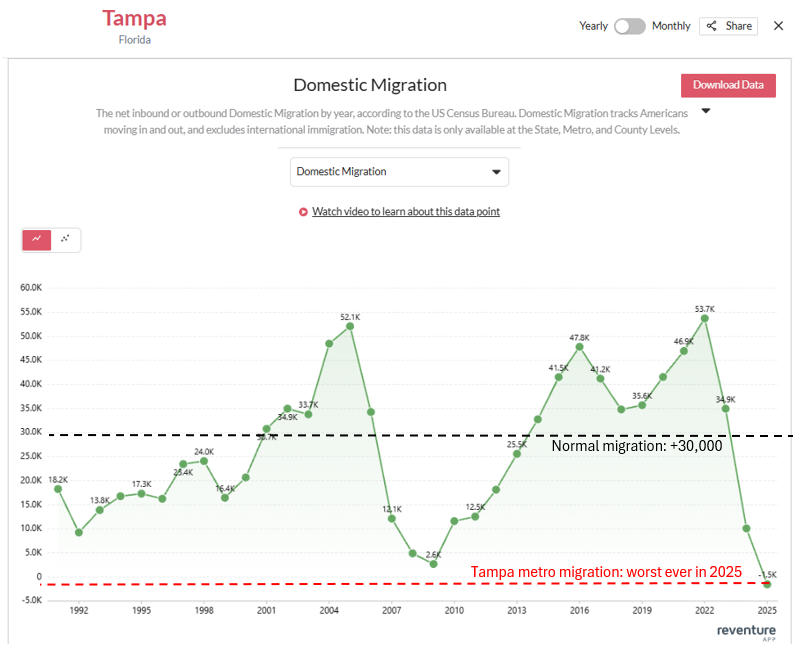
10) One scary thing about the migration graphs in this downturn is how similar they look to 2008. That was the last time, and only time in the last 35 years, when domestic migration has fallen off a cliff like this. In 2025, only 22k net Americans moved to Florida https://t
12.5K views · 40 likes · 4 reposts · 1 replies Open on X →
9) Florida works when the local housing market is reasonably affordable. Giving a runway for local buyers to get in, and people with upper middle incomes across the U.S. to buy 2nd homes. But when it gets too expensive, that calculus breaks down. Locals not only don't buy, but 10.6K views · 37 likes · 1 reposts · 3 replies Open on X →
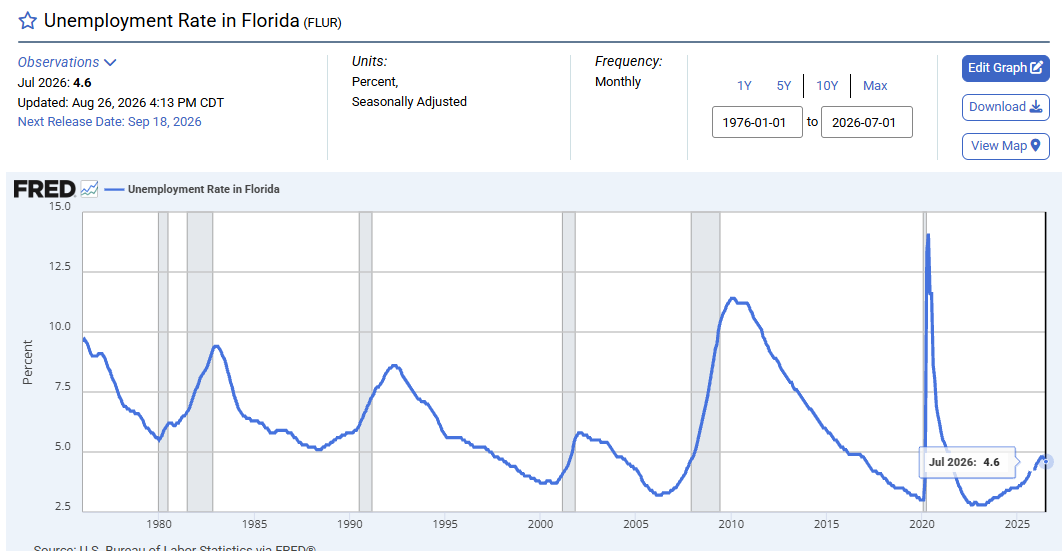
8) in fact, the state-wide unemployment rate in Florida has spiked up to 4.6% in the last three years. While this isn't that high historically, it's still way up from the pandemic lows of around 2.8% unemployment. And suggest a labor market that is beginning to deterioriate, ht
11.9K views · 42 likes · 2 reposts · 1 replies Open on X →
7) Someone in the comments is saying 'this is no big deal' because the decline is "only 1%". This person is missing the point. Any negative in Florida's migration statistics is a massive problem. This is a state that has to be adding significant amounts of people every year 13.2K views · 65 likes · 3 reposts · 3 replies Open on X →
6) Here's the same migration graph in Tampa. Normally, around 30,000 net people per year move to the Tampa metro. But in 2025, -1,500 people left. The worst performance ever for domestic migration (Americans moving in/out). https://t.co/lfsYu6Ed96
14.3K views · 48 likes · 1 reposts · 5 replies Open on X →
@nickgerli1 Its fine. We have so many people in the state. We can lose a bunch more and still be ok. The traffic is brutal now everywhere. Most locals wont mind this 10.3K views · 201 likes · 0 reposts · 12 replies Open on X →
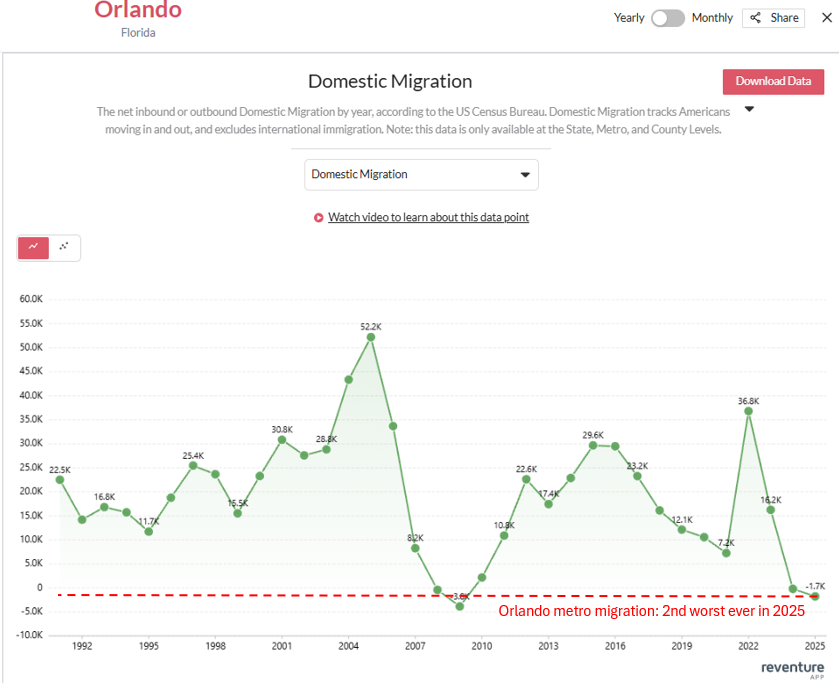
5) Orlando has gone from a population boom area, to a negative growth area, overnight. Which is having massive implications on a housing market that became too expensive for locations, and that has a ton of home building. 20.2K views · 72 likes · 1 reposts · 9 replies Open on X →
4) Take Orlando, for example. At the post-pandemic peak, Orlando's metro-level domestic migration hit a near record of 36,800 in 2022. However, since then, migration has plummeted to -1,700 in 2025. Which was the 2nd worst migration performance on record for the greater https:
23K views · 66 likes · 3 reposts · 6 replies Open on X →
3) I don't think people have put two and two together regarding Florida's housing market yet. A lot of people down there still seem to think 'people are moving in'. And they look at sprawling home building sites as an indication of 'growth'. But there is no growth 22.3K views · 108 likes · 7 reposts · 8 replies Open on X →
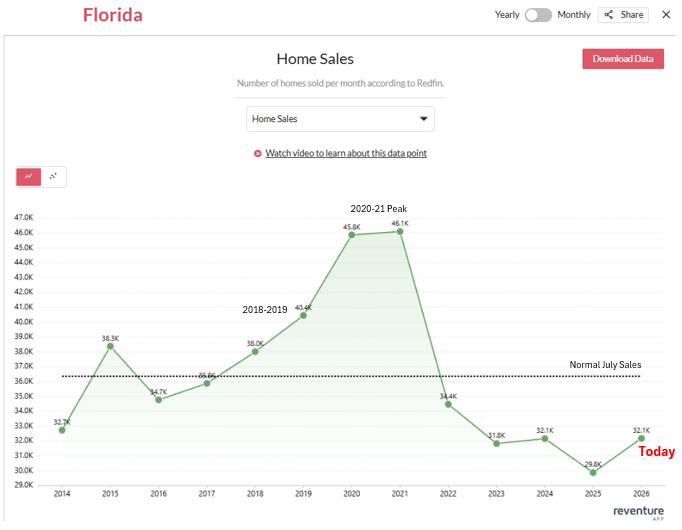
2) In fact, home sales in July 2026 in Florida were near the lowest level in the last 13 years. Still down about 30% from the pandemic peak. And well below pre-pandemic levels. https://t.co/xevGMM6M3E
27.3K views · 125 likes · 9 reposts · 5 replies Open on X →
1) Some corners of real estate was whispering about a "recovery" in Florida's housing market, due to inventory dropping from last year. However, that inventory drop is due to sellers witholding listings. Not more buyer demand. 30.6K views · 141 likes · 6 reposts · 8 replies Open on X →
Florida’s migration reversal is getting ugly. Tampa, Orlando, and Miami all lost population in Q2 2026. In fact - Orlando and Miami lost more people than New York. Not only has Florida's pandemic migration surge dropped off, locals are leaving and some of the state's biggest
665.8K views · 3.2K likes · 609 reposts · 606 replies Open on X →
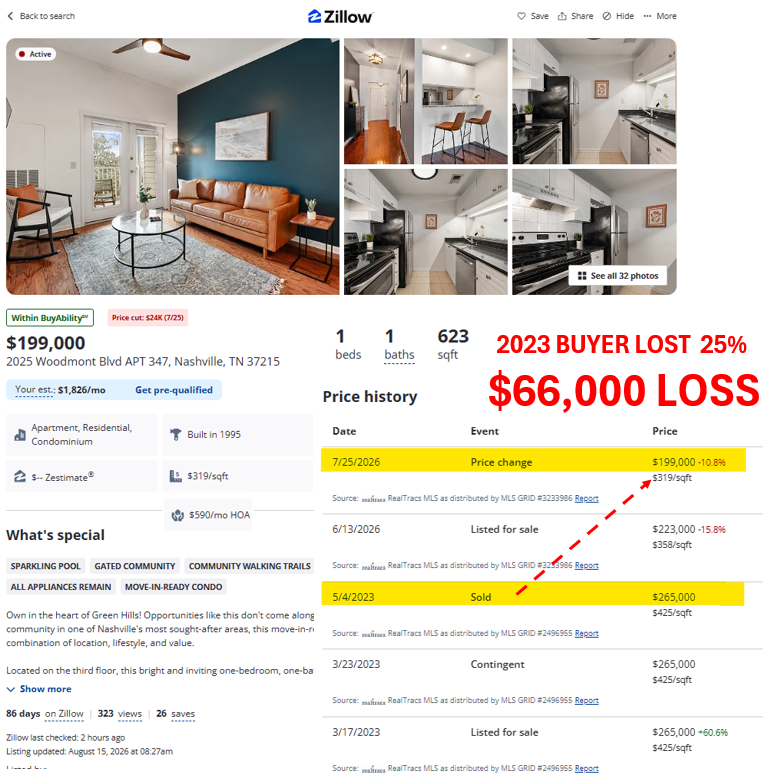
The Sun Belt housing bust is spreading. This owner bought for $265,000 in 2023 during the boom. Now it’s listed for $199,000. That’s a $66,000 loss in just three years. Down 25%. And this is becoming increasingly common across Nashville. California investors and Airbnb http
55.1K views · 433 likes · 57 reposts · 39 replies Open on X →
New house prices are down 15% in the last four years. And for the first time ever, new builds are cheaper than existing houses. With the average new house selling at a $40,000 discount to existing in July 2026. Existing Sale Price: $434,000 New Build Price: $394,000 That's
110.7K views · 764 likes · 117 reposts · 80 replies Open on X →
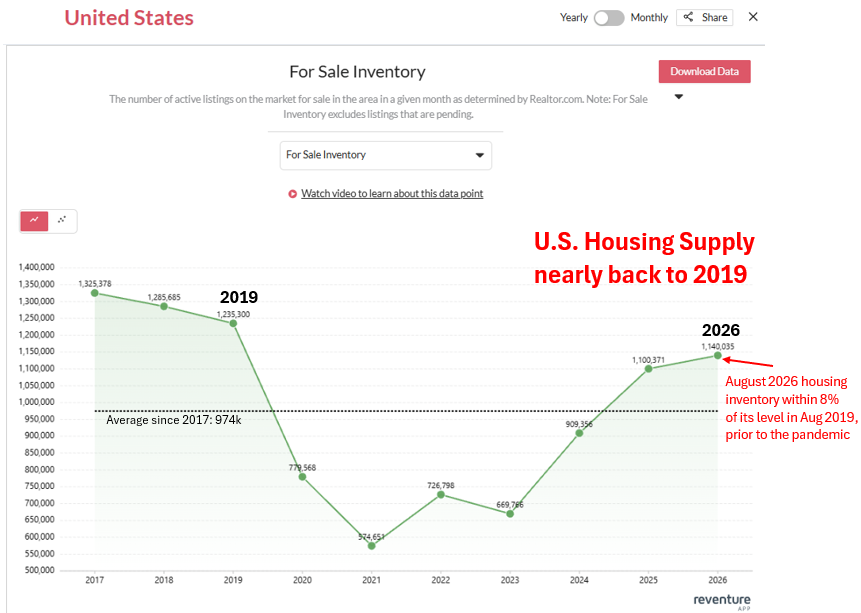
Don't look now, but U.S. Housing Inventory is now almost back to pre-pandemic levels. Aug 2019 supply: 1.24 million listings Aug 2026 supply: 1.14 million listings Meaning the U.S. is now within 8% of its pre-pandemic supply. Current supply levels are also 17% above the ht
55.8K views · 692 likes · 95 reposts · 80 replies Open on X →
12) Log in to Reventure Premium today to access our Overvaluation metrics, so you can be more knowledgable before you buy or sell. Right now premium is only $39/month, and you can cancel at any time. Upgrade now to see the full suite of data. https://t.co/gKaMgNGggB 3.5K views · 6 likes · 0 reposts · 0 replies Open on X →
11) Ultimately, at Reventure, we believe the Home Value/Income Ratio is a foundational cornerstone of housing market analysis. We provide this affordability data for nearly every ZIP code in the U.S., so homebuyers can understand whether it's historically expensive or affordable 3.8K views · 7 likes · 0 reposts · 3 replies Open on X →
10) Also, unemployment is still only 4.1%. And the stock market keeps breaking records. What does "seller resiliency" look like if unemployment were to go past 6%? And the stock market were to have a correction? 2.3K views · 12 likes · 1 reposts · 2 replies Open on X →
9) Think about how weird it is that housing market bulls try to support their view of a strong market by saying 'people will never sell'. But I think the better way to characterize things is: buyers will never return until sellers cut prices. The market clearing price for 2.3K views · 15 likes · 1 reposts · 1 replies Open on X →
8) The one 'saving grace' for the market, and the resiliency of prices, is that a lot of existing owners have cheap mortgage rates and "will never sell". But even that won't last. Just recently, the number of mortgage holders with a rate above 6% eclipsed the number with a rate
2.8K views · 24 likes · 2 reposts · 4 replies Open on X →
7) And this is the key point everyone in housing misses. People continually repeat "there is no bubble". But there's obviously a bubble. Home/Value Income is near highest on record. Demand has crashed to lowest on record. Job growth is going negative. And hardest hit markets 3K views · 20 likes · 0 reposts · 2 replies Open on X →
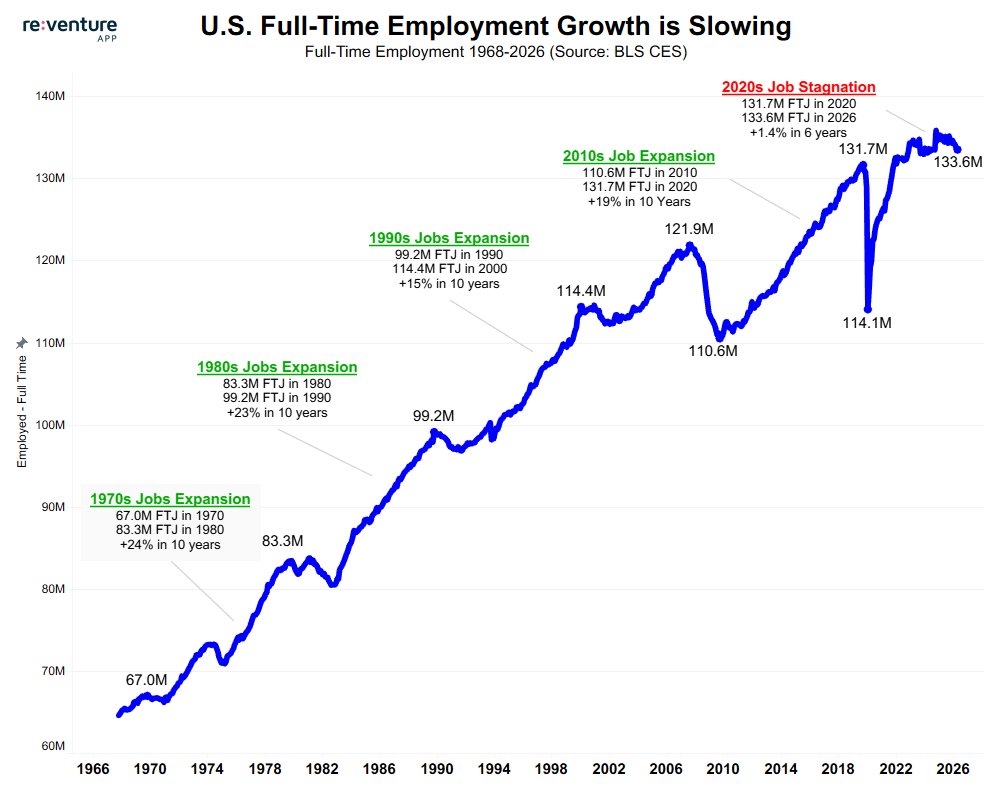
6) Fewer people with full-time jobs, or substantially lower growth in full-time jobs, will mean fewer homebuyers. Especially when you couple that slowing economic growth with the sky-high Home Value/Income Ratio. Both the affordability and economic thumbs are pressing down, 3.3K views · 19 likes · 0 reposts · 1 replies Open on X →
5) For instance, the number of full-time workers in the U.S. economy has only grown by 1.4% so far this decade. It was 131.7M in 2020. It's now 133.6M in 2026. Note how in previous decades the U.S. was achieving 20% full-time employment growth like clockwork. With the https:
3.8K views · 29 likes · 2 reposts · 2 replies Open on X →
4) Because in addition to the lack of affordability today, we're also entering a weak demographic and job growth period. For instance, consider the number of Americans with a full-time job. This figure has contracted by 2M over the last year, and is for the first time in U.S. 4K views · 28 likes · 0 reposts · 2 replies Open on X →
3) There's a delusion persisting in the housing market that somehow the market will eventually recover, or that buyers will jump back in. Or that people should overextend themselves and buy homes they can't afford. However, those things will not happen in the current climate. 4.2K views · 34 likes · 0 reposts · 4 replies Open on X →
2) You can see the spiking Home Value/Income Ratio has caused home sales to plummet. Today's existing sales pace of 4.1M annualized is at 2008 lows. And is actually near the lowest level ever relative to size of housing stock. The history is clear: when Home Value/Income https
6.3K views · 39 likes · 4 reposts · 1 replies Open on X →
@nickgerli1 So, A $500k 30-year "bond" at 3% is only worth about $325k at today’s rates.That $175k is sitting inside the house and effectively stacks on top of what would be a normal clearing price. Sell and you give it up. That’s a big reason prices stay high even with few buyer 1.4K views · 9 likes · 0 reposts · 1 replies Open on X →
1) This chart ultimately explains why homebuyer demand has been so low over the last four years. It's not mortgage rates. It's because home prices spiked way faster than people's incomes during the pandemic. Pricing buyers out of the market. 11.2K views · 84 likes · 5 reposts · 4 replies Open on X →
There's only been three home-price bubbles in U.S. history over the last 70 years. Today, with a Home Price/Income Ratio of 4.33x Back in 2006, when it hit 4.45x. And post WW2, when it hit 5.00x. In the previous two cases, the bubble and lack of affordability didn't last ht
237.8K views · 1.5K likes · 207 reposts · 113 replies Open on X →

Aynı büyüklükteki hesaplara karşı

Son 90 güne ait 30 gönderi, 100K–1M takipçi aralığıyla yan yana. geniş kitleye gösteriliyor, ama izleyenlerin azı tepki veriyor.

Medyan görüntülenme11 216bu hesap6 409100K–1M için medyan
Erişim, %7.15%bu hesap1.86%100K–1M için medyan
Etkileşim, %0.66%bu hesap1.15%100K–1M için medyan
ÖlçütBu hesap100K–1M için medyanOran
Gönderi başına medyan görüntülenme11 2166 4091.75×
Erişim (görüntülenme ÷ takipçi)7.15%1.86%3.84×
Etkileşim oranı0.66%1.15%0.58×

Bu aralıktaki diğer hesaplar →   Başka bir hesapla karşılaştır →   Bu kıyas değerleri nasıl kuruluyor →

Growth & engagement

How the posts we collected actually performed: views and reaction rate post by post, what the audience did with them, and where the follower count goes.

Views per post

55.1K7 Sep
665.8K
30.6K
27.3K
22.3K
23K
20.2K
10.3K
14.3K
13.2K
11.9K
10.6K
12.5K
11.2K

Last 14 collected posts, oldest on the left. The scale is logarithmic: one post can outrun the rest a hundred times over.

Engagement rate per post

0.97%7 Sep
0.68%
0.51%
0.51%
0.55%
0.33%
0.41%
2.07%
0.39%
0.54%
0.38%
0.39%
0.37%
0.40%

Reactions — likes, reposts, replies and quotes — divided by views. Median for 100K–1M accounts is 1.15%.

What the audience does

Likes62.4%7 821 in total
Reposts9.1%1 138 in total
Replies8.1%1 011 in total
Quotes1.4%176 in total
Bookmarks19.1%2 391 in total

Share of every reaction we collected for this account. Replies mean argument, reposts mean endorsement, bookmarks mean the post was worth keeping.

Followers by day

8 Sep

Daily snapshots since 08 Sep 2026; the dashed line is the starting count.

Benzer hesaplar