tweetindex
FR

Tarek Mansour ✓

@mansourtarek_ · New York · joined 17 Feb 2021

MIT Math Nerd. I love free markets.

79 019Followers
2 438Following
7 591Posts total
11.8MViews on collected posts

Derniers posts

@mansourtarek_ Me after my first gold prediction https://t.co/hMN5ZEyi0i
6K views · 157 likes · 8 reposts · 11 replies Open on X →
@mansourtarek_ Congrats! Big unlock, excited to see where we go from here. Happy for pyth to have helped make this happen. 191 views · 13 likes · 2 reposts · 0 replies Open on X →
@mansourtarek_ Ohhh that explains why you were dressed like this today https://t.co/Td08OYc4Up
239 views · 16 likes · 0 reposts · 0 replies Open on X →
@mansourtarek_ https://t.co/FekA8ghNCn
66 views · 9 likes · 0 reposts · 1 replies Open on X →
We just launched gold and silver perpetuals in the US. And commodity derivatives are now our fastest-growing product. Markets started with grain and metals, expanded into rates, indices, and other financial assets, and are now expanding into information itself, pricing not just
0:15
713.7K views · 308 likes · 50 reposts · 57 replies Open on X →
@mansourtarek_ @CryptoKaleo 😂 57 views · 0 likes · 0 reposts · 0 replies Open on X →
@mansourtarek_ @CryptoKaleo Touch some court 146 views · 0 likes · 0 reposts · 0 replies Open on X →
@mansourtarek_ @CryptoKaleo Trying to protect your MMs from getting front run? 169 views · 0 likes · 0 reposts · 0 replies Open on X →
@CryptoKaleo watch the game man. touch some grass 3.2K views · 54 likes · 1 reposts · 5 replies Open on X →
Kalshi Perps at the US Open. The crypto bull market really is back. https://t.co/6OyomneDC1 39.7K views · 192 likes · 15 reposts · 44 replies Open on X →
This is a good example of the power of free markets. Prediction market exchanges are not the only way for sports insurers to offload risk. They could go to specialty re-insurers. But they're expensive, opaque, and limited to large clients. They also often decide not to take on 96K views · 331 likes · 16 reposts · 18 replies Open on X →
Institutional finance has poured more than $60 billion into sports since 2019, across franchises, leagues, media rights, and venues. Sports is now an asset class. When that much capital rides on game outcomes, you have to hedge it. LSU owes Lane Kiffin a $3M bonus if LSU wins 184.1K views · 362 likes · 37 reposts · 20 replies Open on X →
@mansourtarek_ 🚩 Personal foul Using a linear scale for probabilities 15 yard penalty and redo the graphs 35.3K views · 82 likes · 2 reposts · 2 replies Open on X →
Everything except trader count is public data, free from Kalshi's API, if you’d like to reproduce the results. Full study: https://t.co/6NrYpXwsZQ 7.6K views · 52 likes · 1 reposts · 2 replies Open on X →
There's much more we want to study: -How market microstructure drives price discovery -How predictive performance varies across event types -Whether certain trader profiles drive the markets' calibration Want to collaborate on any of this? Reach out: research@kalshi.com 6.6K views · 61 likes · 0 reposts · 9 replies Open on X →
The data from Kalshi's 2M+ markets adds to decades of prediction market research demonstrating their utility: Robin Hanson's foundational work on markets as information-aggregation mechanisms, Justin Wolfers and Eric Zitzewitz's studies of prediction market accuracy, Koleman 9.1K views · 47 likes · 0 reposts · 1 replies Open on X →
How should we use the odds that people on prediction markets generate? It starts by understanding what they mean. Probabilistic thinking doesn't come naturally. Our brains want answers: it will happen, or it won't. But the world doesn't work that way. When markets say 70%, it 7.5K views · 51 likes · 0 reposts · 3 replies Open on X →
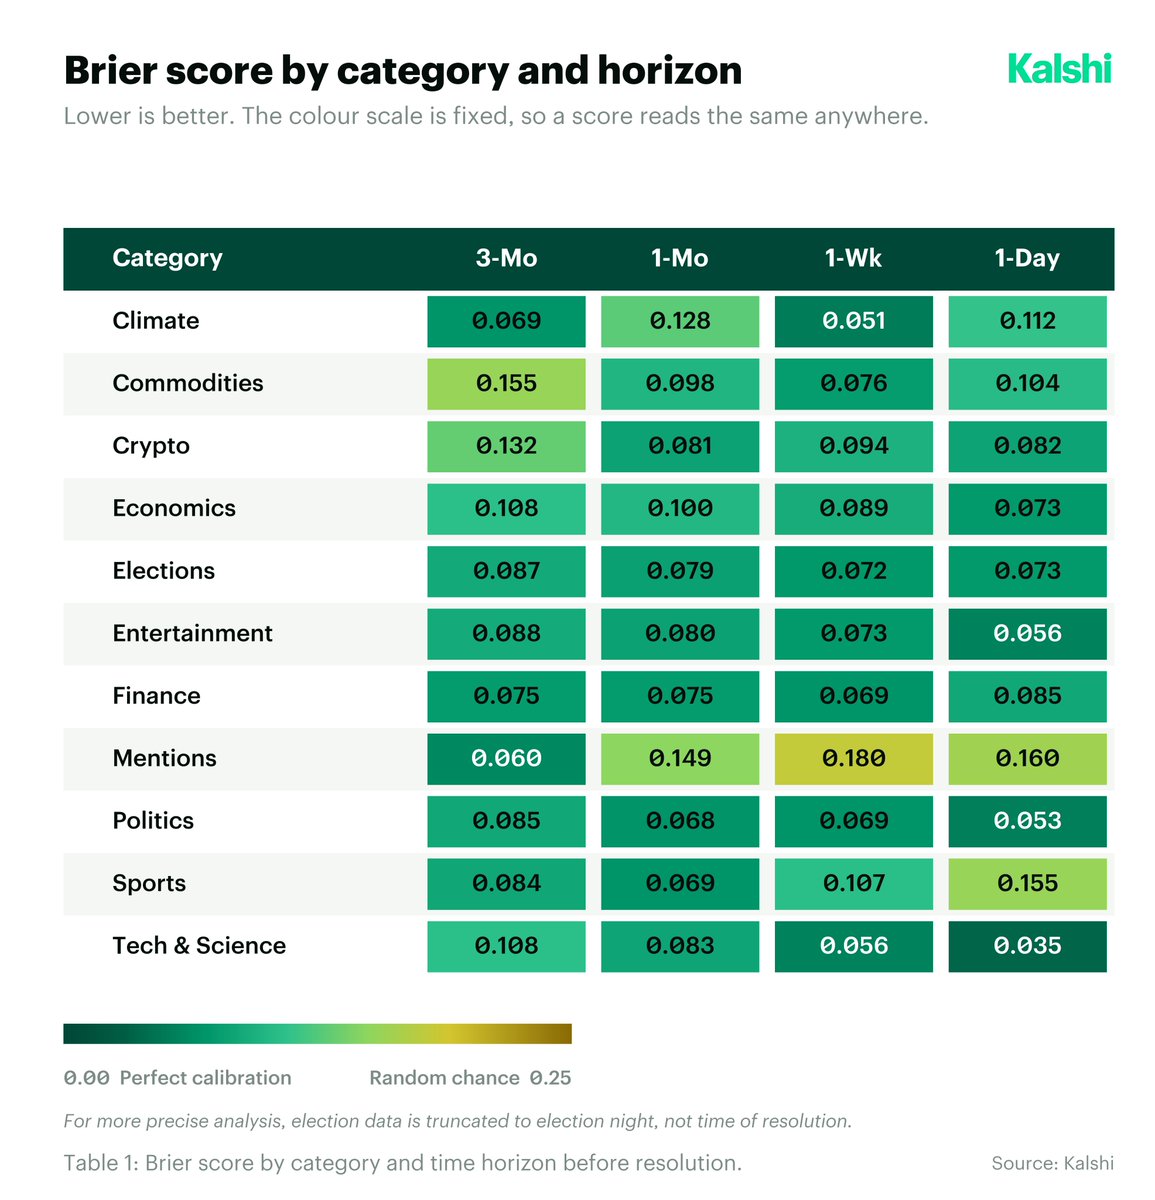
What categories have the best forecasts? Across time horizons, elections, politics, and entertainment markets are the most calibrated. Brier scores by category and time horizon: https://t.co/m2QQzGr857
31.5K views · 87 likes · 5 reposts · 3 replies Open on X →
So how does the crowd stack up? One benchmark: the experts. Philip Tetlock spent 20 years scoring 82,000+ forecasts from PhDs to government advisors to pundits in the media. His conclusion: the average expert was "roughly as accurate as a dart-throwing chimpanzee." (Brier 9.1K views · 56 likes · 1 reposts · 1 replies Open on X →
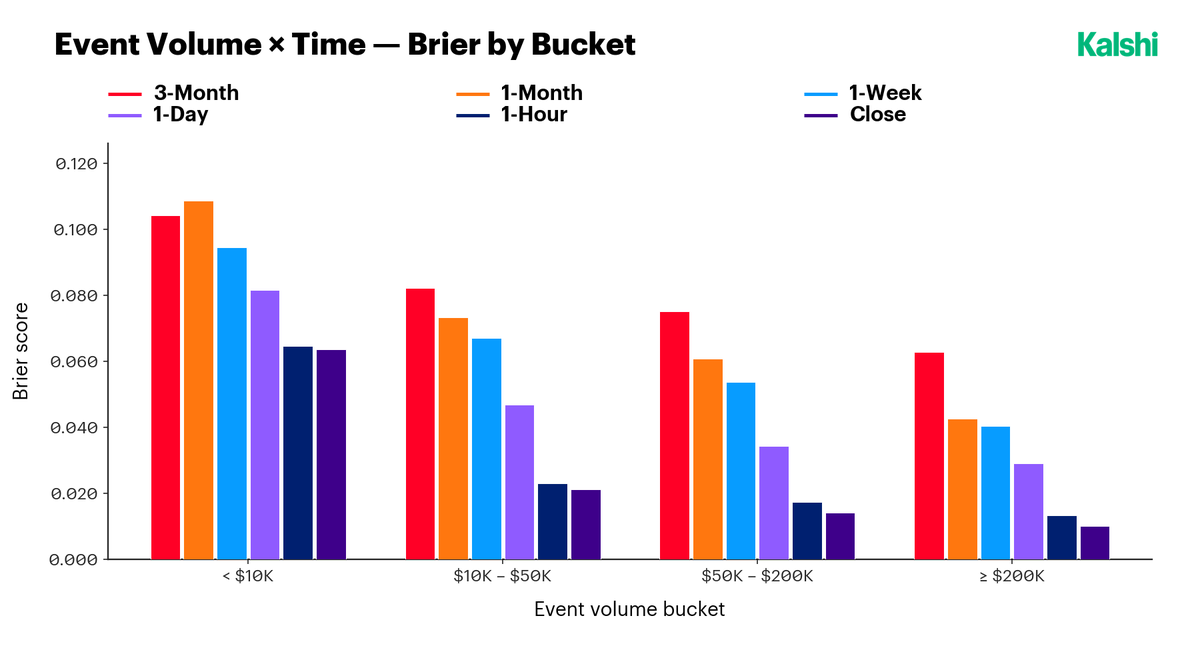
Even markets where people have traded less than $10,000 score ~0.100 a month out. Yes, more money sharpens the forecast. But the data shows you don't need Wall Street money to produce useful information. https://t.co/3QvB1GpH0y
16.3K views · 53 likes · 0 reposts · 1 replies Open on X →
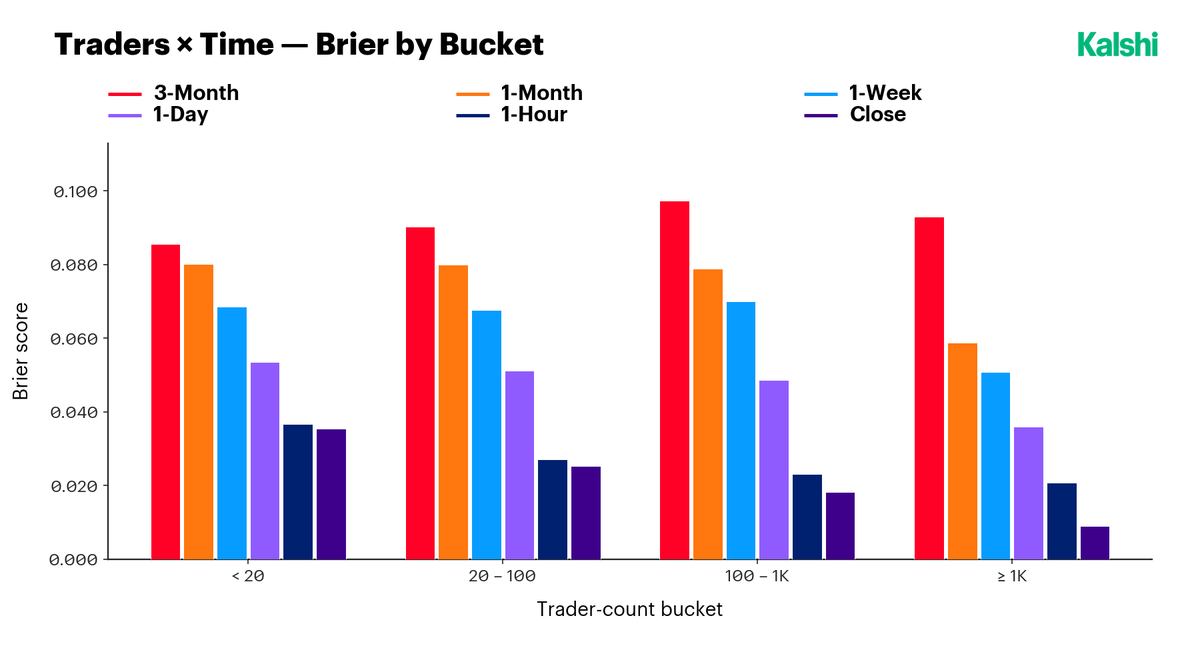
Does the crowd get smarter as it grows? A handful of regular people can already forecast well — even markets with fewer than 20 traders forecast accurately, at ~0.080 a month out. But the more who participate, the sharper the market gets. https://t.co/KiFNkqlsS9
12.6K views · 65 likes · 2 reposts · 1 replies Open on X →
Sports, mentions, and intraday markets are unique because there is a rapid influx of price-relevant information as the event unfolds. Examining the sample where information can be aggregated in advance (so, removing those market categories) provides a clearer measure of https:/
13K views · 53 likes · 2 reposts · 2 replies Open on X →
To quantify this, we use the Brier score: the mean squared error between price and outcome. Lower scores are better. 0 = perfect, 1 = maximally wrong. Random chance is 0.25. Winning scores in forecasting competitions are typically around 0.07 to 0.15. Traders on Kalshi score
20.8K views · 62 likes · 1 reposts · 2 replies Open on X →
The underlying hypothesis: let everyone participate, reward accuracy, and the resulting prices carry real signal. Those prices represent probabilities. In a well-calibrated market, events priced at 5% should resolve yes about 1 in 20 times. 22.3K views · 92 likes · 1 reposts · 1 replies Open on X →
Across 2M+ markets, that's what we observe: 5% markets resolve yes roughly 1 in 20 times. This holds across the price range — market odds track observed frequencies. Here's the calibration of Kalshi traders over time (perfect calibration = the gray 45° line): https://t.co/pCZAIf
19.3K views · 86 likes · 3 reposts · 2 replies Open on X →
Most information we consume is top-down, filtered by a small set of people in tech companies, newsrooms, and elite circles. Prediction markets are bottom-up: information generated by the crowd, with participants rewarded for being right. 23K views · 120 likes · 4 reposts · 1 replies Open on X →
Esoteric or niche hedges are difficult through traditional insurers or re-insurers. Competitive exchanges make it possible by matching those who have the risk but cannot bear it with those who do not have the risk but are actively looking for idiosyncratic returns. 86.8K views · 253 likes · 7 reposts · 14 replies Open on X →
Meet Tim Arrowsmith, the man behind the strangest financial transaction of 2026. Tim is a goat herder in Redding, California, about five hours north of San Francisco close to the Oregon border. He lives outside of a small town in an area historically known as “Poverty Flats” 49.5K views · 141 likes · 33 reposts · 18 replies Open on X →
2026 journalism: > define agenda: “PMs are terrible” > handpick ppl to validate. ignore everyone else > write 197.5K views · 1.1K likes · 15 reposts · 24 replies Open on X →
@mansourtarek_ Man this era of tech is so lame. 2008: we put the internet in your pocket Today: we rebranded your crippling gambling addiction as “predictions” and put that in your pocket. 11.3K views · 455 likes · 17 reposts · 8 replies Open on X →

Face aux comptes de taille comparable

29 posts des 90 derniers jours, à côté de la tranche de 10K–100K abonnés. diffusé largement, mais peu de ces spectateurs réagissent.

Vues médianes13 034ce compte924médiane pour 10K–100K
Portée, %16.49%ce compte3.62%médiane pour 10K–100K
Engagement, %0.47%ce compte1.52%médiane pour 10K–100K
IndicateurCe compteMédiane pour 10K–100KRapport
Vues médianes par post13 03492414.1×
Portée (vues ÷ abonnés)16.49%3.62%4.56×
Taux d'engagement0.47%1.52%0.31×

Autres comptes de cette tranche →   Comparer avec un autre compte →   Comment ces repères sont établis →

Growth & engagement

How the posts we collected actually performed: views and reaction rate post by post, what the audience did with them, and where the follower count goes.

Views per post

7.6K20 Aug
35.3K
184.1K2 Sep
96K
39.7K3 Sep
3.2K
1694 Sep
146
57
713.7K14 Sep
66
239
191
6K

Last 14 collected posts, oldest on the left. The scale is logarithmic: one post can outrun the rest a hundred times over.

Engagement rate per post

0.72%20 Aug
0.25%
0.23%2 Sep
0.38%
0.64%3 Sep
1.90%
0.00%4 Sep
0.00%
0.00%
0.06%14 Sep
15.15%
6.69%
7.85%
2.92%

Reactions — likes, reposts, replies and quotes — divided by views. Median for 10K–100K accounts is 1.52%.

What the audience does

Likes84.2%4 367 in total
Reposts4.3%223 in total
Replies4.8%251 in total
Quotes1.0%50 in total
Bookmarks5.7%296 in total

Share of every reaction we collected for this account. Replies mean argument, reposts mean endorsement, bookmarks mean the post was worth keeping.

The follower curve appears once this account has two daily snapshots — we take one a day, and this one is on its first.

Comptes similaires