tweetindex
IT

Daily Chartbook ✓

@dailychartbook · Miami, FL · joined 21 Jul 2022

The day's best charts & insights, curated: https://t.co/N9qmOV94DF Backtests: https://t.co/wxCAzTDjPz

44 579Followers
459Following
35 573Posts total
146.7KViews on collected posts

Ultimi post

@dailychartbook would be interesting to see if the ai exposed occupations have seen adoption of ai + productivity gains, if not then just a form of baumols cost disease 97 views · 2 likes · 0 reposts · 0 replies Open on X →
@dailychartbook so , incredibly, "experts" were deadly wrong for the first time in human history. How is this possible? it's not like it happened regularly at every pivotal point in our recent history, so we couldn't predict this 351 views · 2 likes · 0 reposts · 0 replies Open on X →
@dailychartbook AI exposure paying a premium is wild but makes sense. 75 views · 1 likes · 0 reposts · 0 replies Open on X →
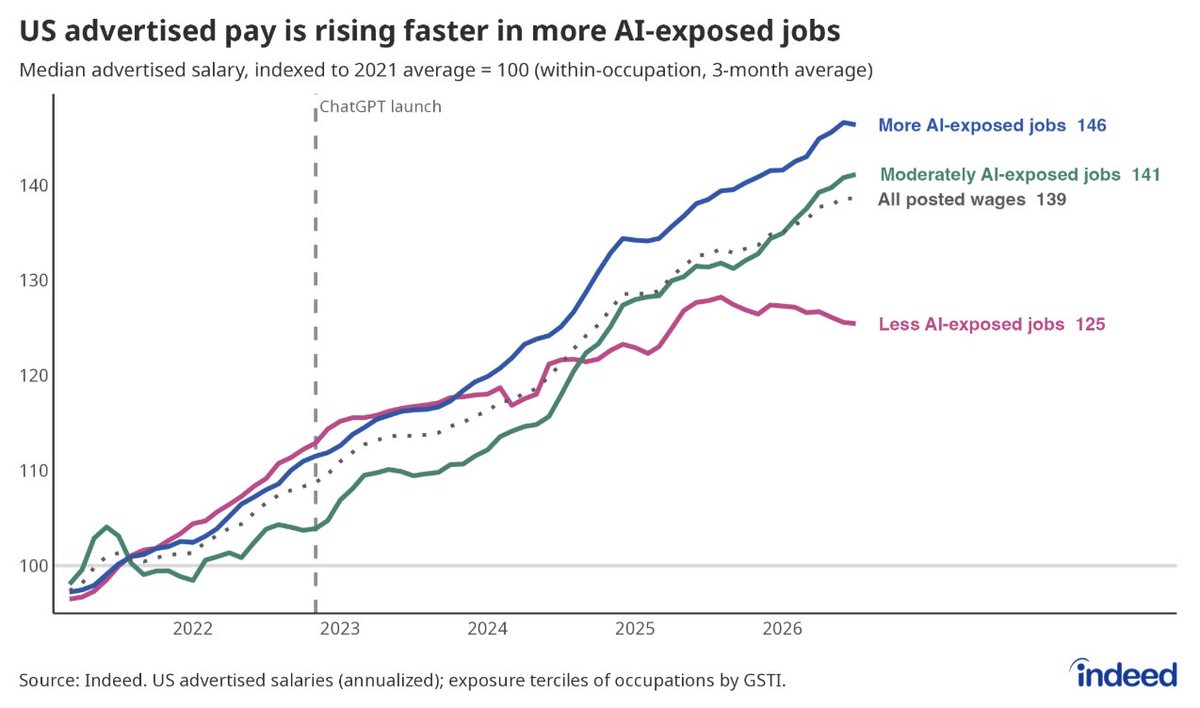
"Since 2021, advertised pay in the most AI-exposed occupations has climbed by about 46% (versus 25% in the least-exposed)." -Indeed https://t.co/PG1ivaJpvl
43K views · 46 likes · 10 reposts · 3 replies Open on X →
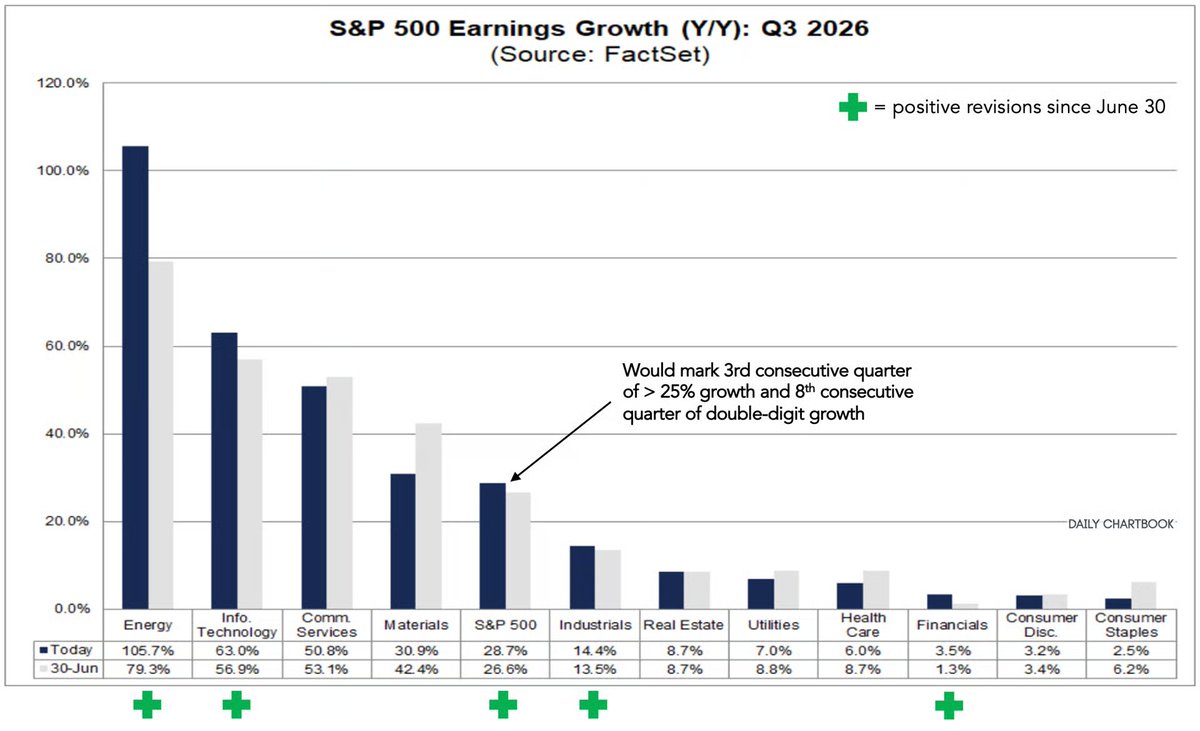
Analysts' optimism toward Q3 earnings continues: estimates are now up 1.4% since June 30 (vs. 1.2% last week). All 11 sectors are expected to see positive YoY growth, led by Energy, Tech, and Communication Services. via @FactSet https://t.co/D6oz7Ebrsd
2.5K views · 5 likes · 0 reposts · 2 replies Open on X →
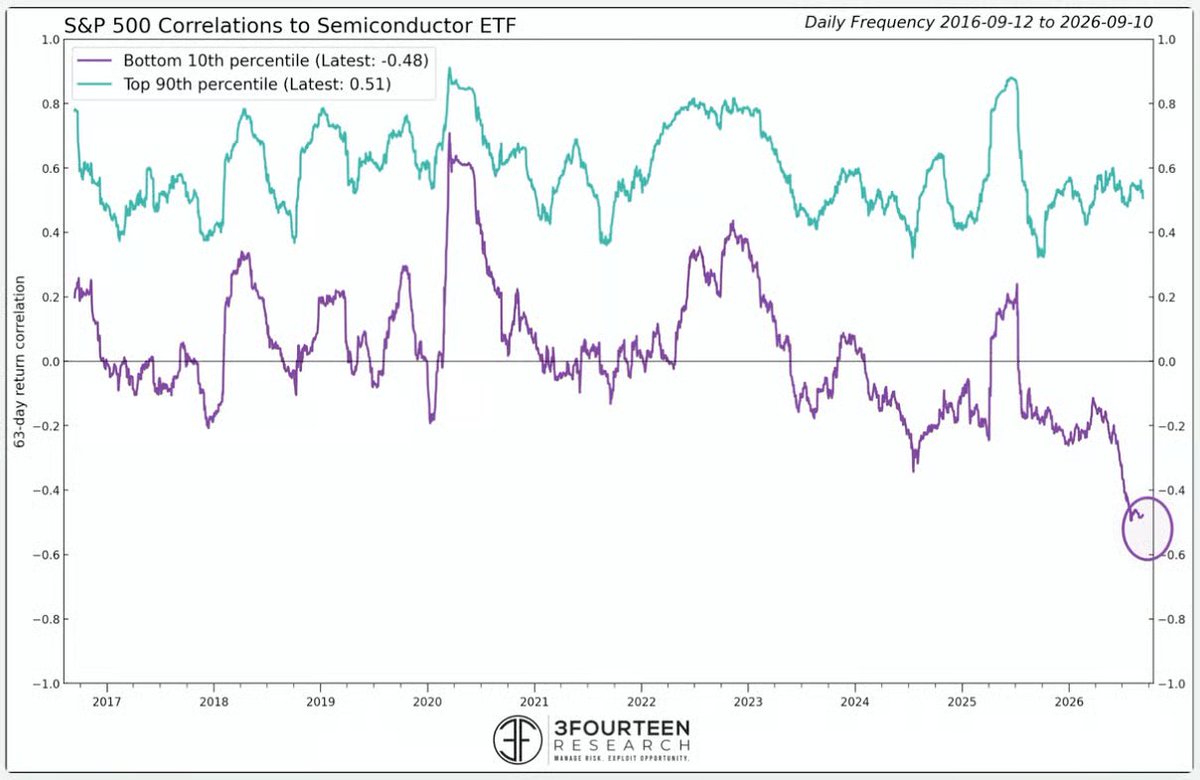
"A good chunk of the stock market is trading like a bet against semis. Across all stocks, the 10th percentile correlation with semis is the most negative in 35 years." @fernavid @3F_Research https://t.co/Pa4q7MLD92
2.8K views · 6 likes · 1 reposts · 1 replies Open on X →
@dailychartbook @scottcharts Sentiment indicators were created 20-30 years ago, when there wasn't data available. If you can easily measure, or think you can measure, how people are thinking, then you would assume they will act a certain way. That's not necessary anymore. Actua 17 views · 0 likes · 0 reposts · 0 replies Open on X →
@dailychartbook @scottcharts Sentiment is interesting and I've used and tracked it for over 20 years but my understanding of it now is: I'd rather see the real data and just tell me what they're doing not what they're thinking. I don't care what they're thinking. 31 views · 0 likes · 0 reposts · 0 replies Open on X →
@dailychartbook @scottcharts Adding one sentence beneath each screenshot turned out to be worth the extra minute. 20 views · 0 likes · 0 reposts · 0 replies Open on X →
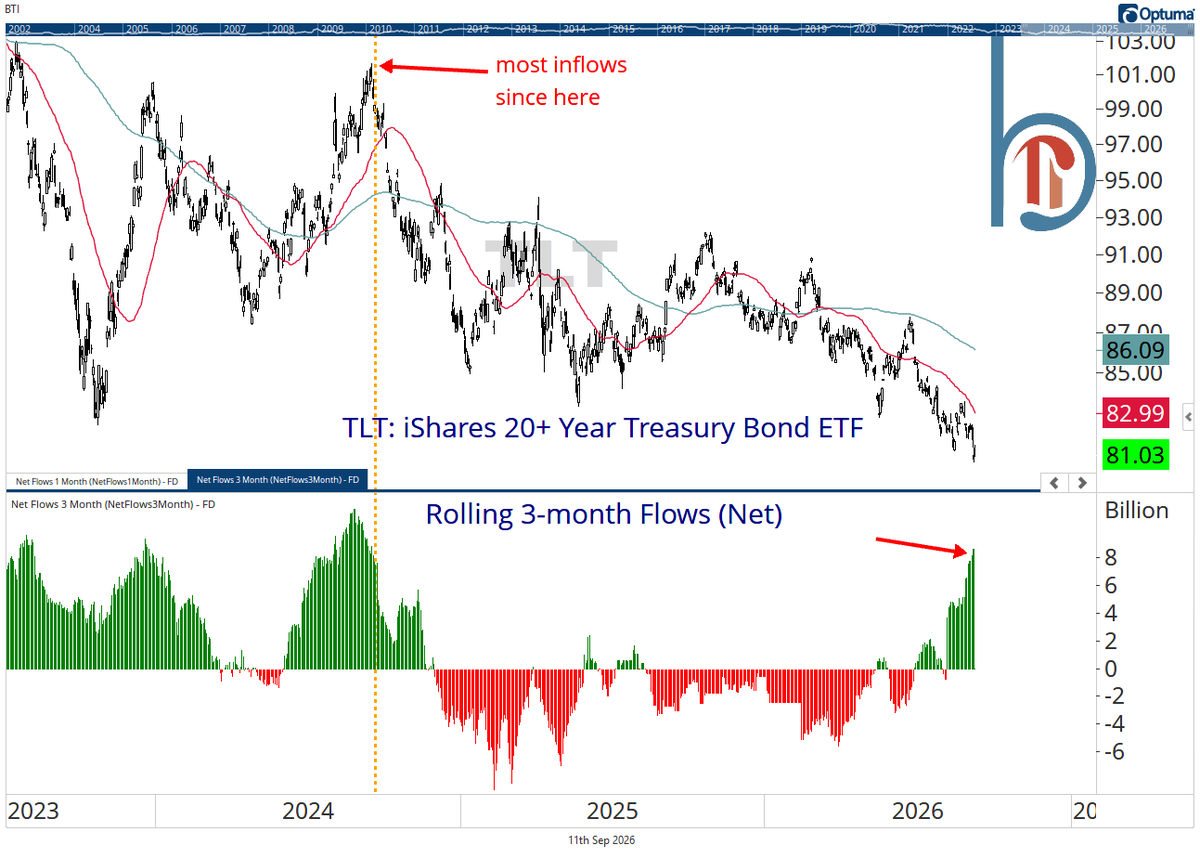
"Lots of ways to measure sentiment, but more than a few people seem to think buying Treasuries is a good idea. Most inflows into TLT since September 2024, which did not work out great" @scottcharts https://t.co/qwnAXVHMSS
3.5K views · 12 likes · 0 reposts · 5 replies Open on X →
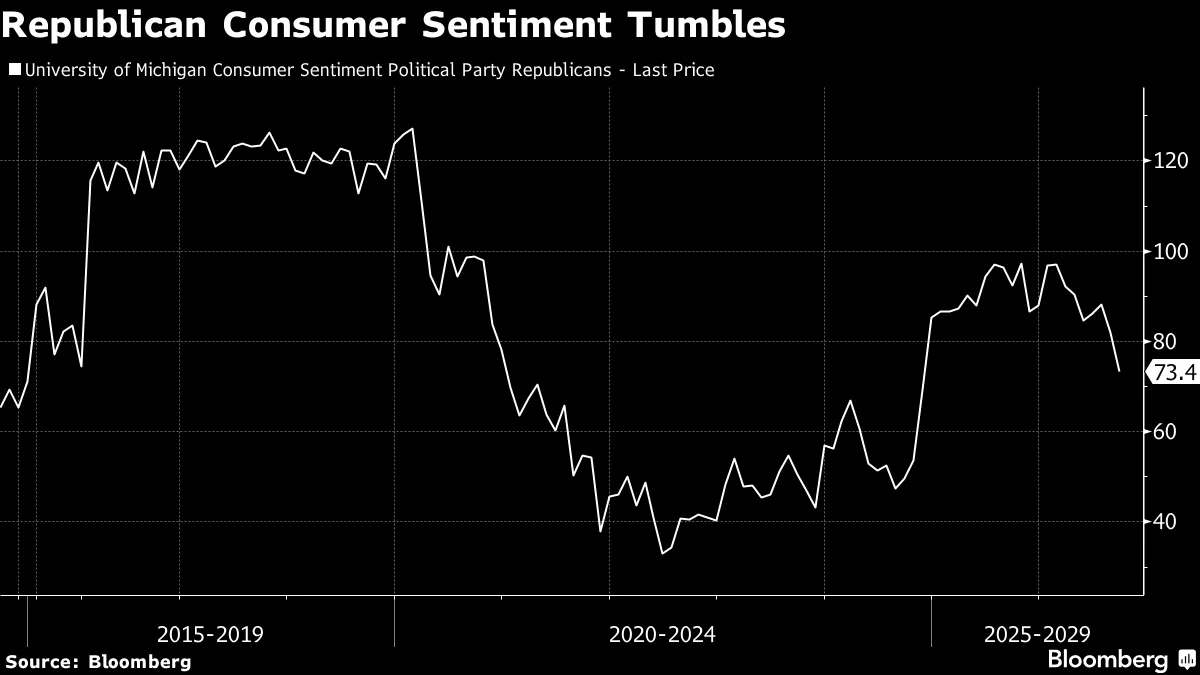
@dailychartbook @TheStalwart The headline isn’t another weak print. It’s the 2024 bounce among Republicans giving most of it back. 73.4 is the number that matters on that chart. 60 views · 0 likes · 0 reposts · 0 replies Open on X →
@dailychartbook @TheStalwart A habit that stayed with me: saving the pre-gap setup without redrawing it. 47 views · 0 likes · 0 reposts · 0 replies Open on X →
"Another bad consumer sentiment reading is, in itself, not big news anymore ... What's notable here is that consumer sentiment among Republicans is now tumbling, erasing most of the gains made since Trump's victory at the end of 2024." @TheStalwart https://t.co/ltDLDuM0i0
5.8K views · 9 likes · 1 reposts · 2 replies Open on X →
Get charts and insights like this one delivered straight to your inbox every weeknight: https://t.co/hEzCXSE1Je 1.5K views · 0 likes · 0 reposts · 0 replies Open on X →
@dailychartbook @patrick_saner No shit Citadel Sherlock. 2 months late with that insight 662 views · 4 likes · 0 reposts · 0 replies Open on X →
"Jevons Paradox is real: token prices have declined but compute prices have remained elevated, suggesting that there is a huge increase in demand for inference as token prices decline." Citadel Securities via @patrick_saner https://t.co/di7zp7aDFB
86.2K views · 727 likes · 144 reposts · 17 replies Open on X →
I look at hundreds of charts a day. 📈📊📉 After the bell, I curate the best ones and send them to investors. Subscribe to be one of them 👇 https://t.co/n7eCrpXfel 0 views · 238 likes · 20 reposts · 14 replies Open on X →

Rispetto ad account della stessa dimensione

16 post degli ultimi 90 giorni, accanto alla fascia di 10K–100K follower. sotto i pari sia per copertura sia per interazione.

Visualizzazioni mediane506questo account924mediana per 10K–100K
Copertura, %1.14%questo account3.62%mediana per 10K–100K
Interazione, %0.24%questo account1.52%mediana per 10K–100K
MetricaQuesto accountMediana per 10K–100KRapporto
Visualizzazioni mediane per post5069240.55×
Copertura (visualizzazioni ÷ follower)1.14%3.62%0.31×
Tasso di interazione0.24%1.52%0.16×

Altri account di questa fascia →   Confronta con un altro account →   Come sono costruiti questi parametri →

Growth & engagement

How the posts we collected actually performed: views and reaction rate post by post, what the audience did with them, and where the follower count goes.

Views per post

1.5K21 Aug
5.8K12 Sep
47
60
3.5K
20
31
17
2.8K
2.5K
43K18 Sep
75
351
9719 Sep

Last 14 collected posts, oldest on the left. The scale is logarithmic: one post can outrun the rest a hundred times over.

Engagement rate per post

0.00%21 Aug
0.21%12 Sep
0.00%
0.00%
0.49%
0.00%
0.00%
0.00%
0.29%
0.28%
0.15%18 Sep
1.33%
0.57%
2.06%19 Sep

Reactions — likes, reposts, replies and quotes — divided by views. Median for 10K–100K accounts is 1.52%.

What the audience does

Likes56.3%814 in total
Reposts10.8%156 in total
Replies2.1%30 in total
Quotes2.1%30 in total
Bookmarks28.7%415 in total

Share of every reaction we collected for this account. Replies mean argument, reposts mean endorsement, bookmarks mean the post was worth keeping.

The follower curve appears once this account has two daily snapshots — we take one a day, and this one is on its first.

Account simili

Frequently asked questions about @dailychartbook

How many followers does @dailychartbook have?

44 579 followers.

How many posts has @dailychartbook published?

35 573 posts.

How do posts by @dailychartbook perform?

Collected posts: 17. Views: 146 727. Likes: 1 052.