tweetindex
EN

PlanB ✓

@100trillionUSD · joined 13 Oct 2017

All models are wrong, some are useful. DYOR! 👉 https://t.co/4UQOQ8eRA3

2 164 114Followers
163Following
12 713Posts total
3.8MViews on collected posts

Latest posts

Just a scenario for the second half of this halving cycle, Apr 2024 - Apr 2028 (no not a prediction, just a scenario, food for thought, you assign the odds): 🔳 $100K in October 🔳 New ATH (>$126K) before Christmas 🔳 2027 - 2028: >$232K (4x $58K bottom) What do you think? 319.1K views · 4K likes · 306 reposts · 336 replies Open on X →
⚠️Stop blaming influencers for your investment results! That’s not analysis. That’s outsourcing responsibility. Do this instead: - Follow bulls AND bears - Steal their reasoning - Ignore their certainty - Assign your own odds (60/40, 70/30, whatever) - Size the trade yourself h
113K views · 1K likes · 69 reposts · 63 replies Open on X →
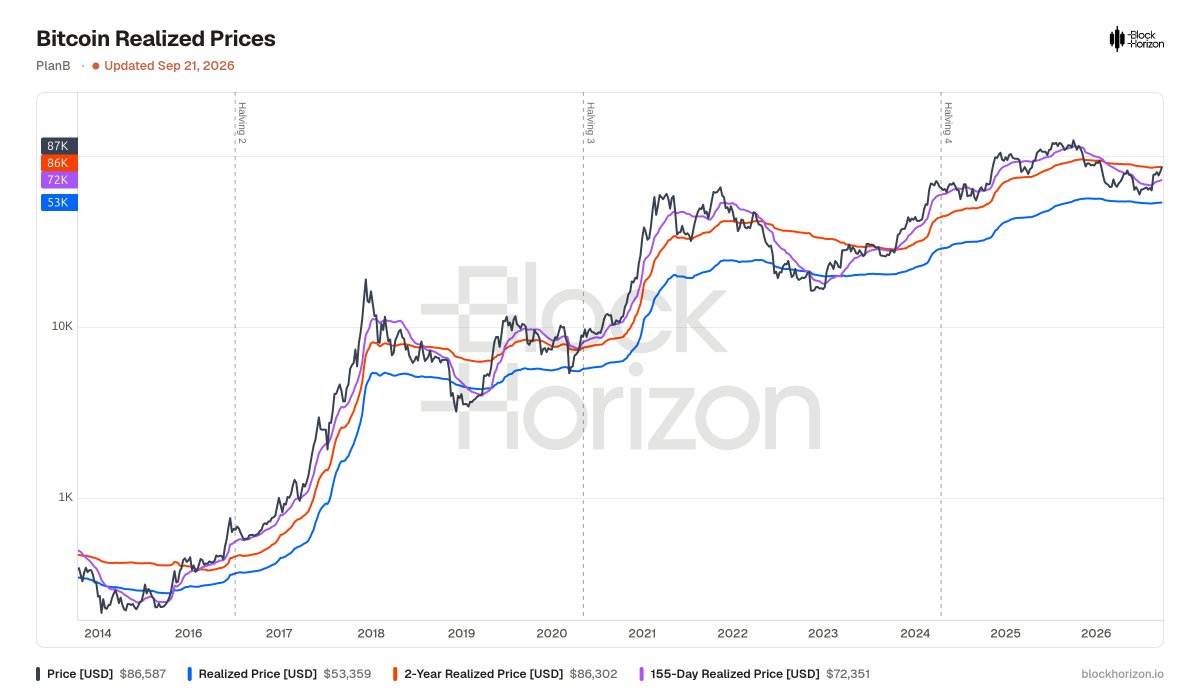
BTC $87K is now sitting above every major realized price: • Realized price: $53K • 155-day realized: $72K • 2-year realized: $86K A drop below $53K this cycle is off the table IMO. The “must retest realized price like every prior bear” thesis just lost its last clean setup. htt
271.9K views · 3.4K likes · 317 reposts · 120 replies Open on X →
Last time you’ll see Bitcoin under $100k? Look at the October column. Uptober is loading.🎃📈 https://t.co/ltCDf9TaXD
203.6K views · 3.3K likes · 293 reposts · 112 replies Open on X →
Bitcoin ($81k) closed above 50-week MA ($79k). Next target: 100-week MA ($89k) 🚀 Interactive chart: https://t.co/OrlNcbTbZf https://t.co/ok7HnDVcL7
189K views · 2.9K likes · 283 reposts · 103 replies Open on X →
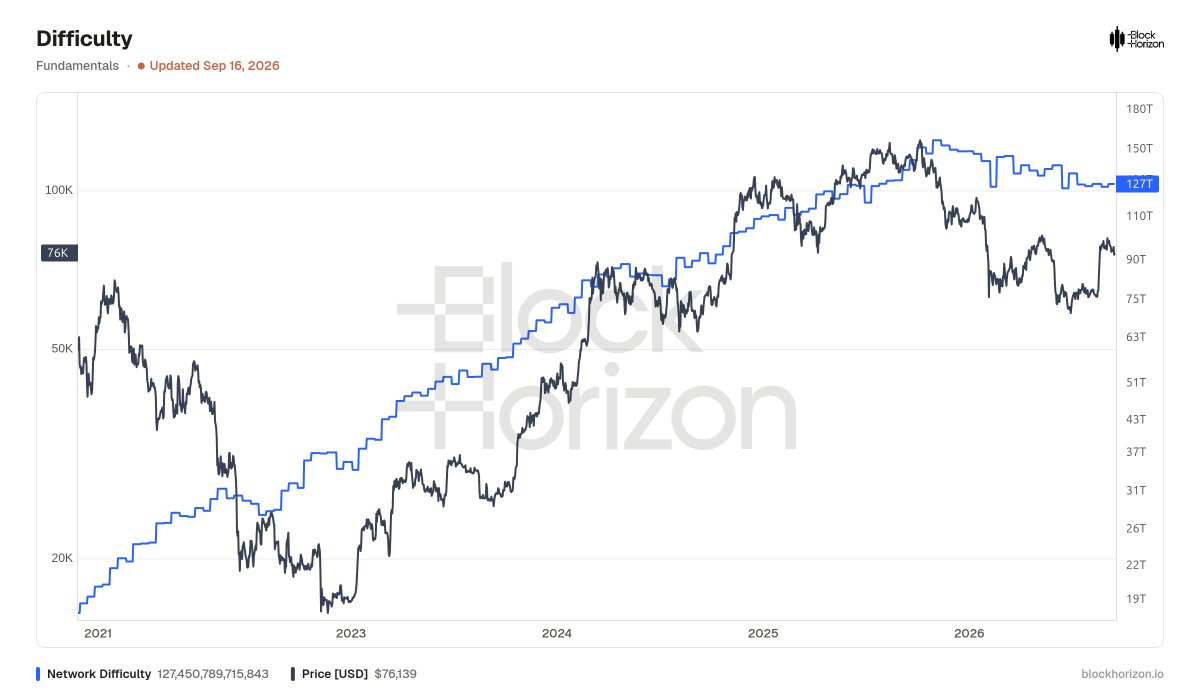
🟦Now we wait until bitcoin difficulty goes up .. Interactive difficulty chart: https://t.co/zDeHD2HAnj https://t.co/zDKCqZWohO
158.1K views · 1.3K likes · 102 reposts · 46 replies Open on X →
Bitcoin left the 200-week moving average again. BTC price: $77k 200WMA: $65k 🔵Every cycle bottom happened when the rainbow turned blue. The people who bought the last three times this happened made generational wealth. Interactive chart👉https://t.co/sbL34SBSjq https://t.co/3Gi
353.6K views · 4K likes · 465 reposts · 162 replies Open on X →
$77k bitcoin is squeezed between two giant walls: 🟠 1M BTC sitting at $62–65k 🔵 1M BTC sitting at $84–87k Which way does it break $65k or $84k? Live interactive version of this chart 100% free (full history, daily updates, alerts, CSV/XLS/JSON data): https://t.co/2WM9TfT8Mm ht
256.1K views · 2.5K likes · 262 reposts · 206 replies Open on X →
You used to pay $1,000-$10,000/y for bitcoin metrics. That era just ended. BlockHorizon opened the full stack, 100% free: ✅ 100+ charts (MVRV, NUPL, Realized, S2F) ✅ Full historic data, daily updates ✅ Unlimited alerts ✅ CSV/Excel/JSON downloads 👉 https://t.co/WGsyMg0mYu https:
390K views · 4.6K likes · 608 reposts · 127 replies Open on X →
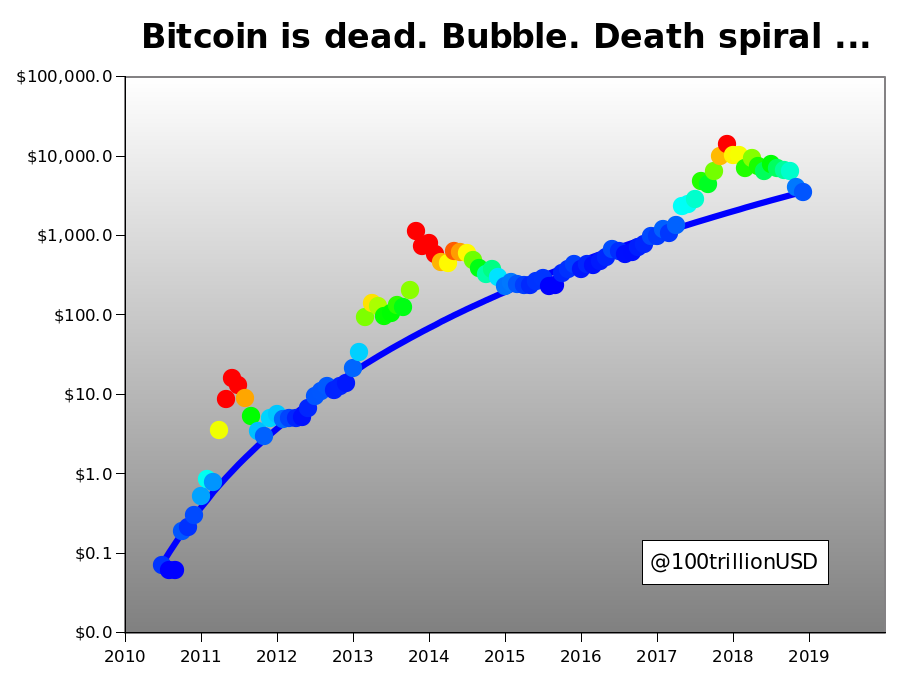
One of my first tweets, 2018, pre-S2F, most people thought bitcoin was like the Tulip Bubble ... 287.9K views · 2.2K likes · 180 reposts · 84 replies Open on X →
Bitcoin just ran $58K → $78K. Was July 1 the bear-market bottom? 141.4K views · 421 likes · 40 reposts · 55 replies Open on X →
Bitcoin closed August at $78,571 - Above 200 week MA $65k - Above 5 month (STH) realized price $72k - All realized prices are increasing again - Bitcoin in profit 72% (up from 50%) - Monthly RSI 51 (up from 41) IMO the bottom is behind us. I expect higher prices from here. http
252.9K views · 4.4K likes · 505 reposts · 202 replies Open on X →
@100trillionUSD Is that a green dot? The next phase has begun. 5.2K views · 19 likes · 0 reposts · 1 replies Open on X →
@100trillionUSD Imagine if Bitcoin regained the S2F 😄 Bears would be on suicide watch. 6.6K views · 38 likes · 0 reposts · 3 replies Open on X →
@100trillionUSD PlanB is back https://t.co/GgvmGhthct 6.9K views · 68 likes · 0 reposts · 2 replies Open on X →
✅Bitcoin in profit > 70% (color overlay in this chat) ✅BTC > 200 week moving average (black line) ✅RSI > 50 (trend is up) ✅QE restarted Feels like the bear is dead and bulls are in charge🚀 https://t.co/kU0nUJXtdW
376.8K views · 3.8K likes · 407 reposts · 185 replies Open on X →
10) Institutional + nation-state adoption amplifies the thesis (ETFs, corporate treasuries, potential sovereign interest) but also raises the stakes: network security, resilience, and possible geopolitical tension if Bitcoin challenges existing monetary systems. 26.2K views · 109 likes · 3 reposts · 5 replies Open on X →
9) Bitcoin behaves like a monetary black hole. As S2F rises and adoption grows, it competes with, and can siphon premium from, gold, real estate, and other stores of value. This has consequences for inflation hedging, capital allocation, and traditional finance. 27.9K views · 98 likes · 2 reposts · 3 replies Open on X →
8) Different models (S2F/S2FX, power-law, lengthening cycles, diminishing returns) often converge on substantially higher long-term prices. They diverge on timing of peaks, cycle length, and how fast returns diminish. Time + data will sort them. 13.4K views · 70 likes · 0 reposts · 2 replies Open on X →
7) Asymmetric risk/reward is the real portfolio edge. Bitcoin has been the best-performing major asset on both absolute and risk-adjusted (Sharpe/Sortino/Calmar) bases over multi-year periods. Even a small 1% allocation mixed with cash/traditional assets historically improved 13.9K views · 78 likes · 0 reposts · 1 replies Open on X →
6) Scarcity alone is not enough. Any token can copy a fixed supply schedule. Bitcoin’s edge is decentralized, unforgeable, censorship-resistant hard money + genuine network demand. Copycats lack that. 14.5K views · 93 likes · 1 reposts · 2 replies Open on X →
5) “All models are wrong, but some are useful.” I repeat this constantly. S2F is a simple scarcity tool for long-term framing, not a crystal ball or day-trading system. It has held through COVID, the China ban, and more. Still imperfect. Still useful. 15.5K views · 94 likes · 0 reposts · 3 replies Open on X →
4) Bitcoin evolves in phases tied to rising S2F: Proof-of-concept → payments network → e-gold/store of value → institutional-grade financial asset. Each jump in scarcity brings broader narratives and new capital. 16.5K views · 86 likes · 2 reposts · 1 replies Open on X →
3) S2F (and S2FX) estimate average/fair value, not exact tops or bottoms. Price oscillates around the model line. Historically cited cycle averages: ~$50k (S2F) and higher figures near $288k (S2FX cross-asset). Focus on the multi-year mean, not the one-day peak. 17.8K views · 87 likes · 1 reposts · 1 replies Open on X →
2) Halvings are the engine. Every ~4 years the block reward halves. S2F roughly doubles. The model treats them as the core supply-side events. 22.8K views · 107 likes · 1 reposts · 1 replies Open on X →
@100trillionUSD Stock-to-Flow? Bro, my portfolio is currently running on a Shock-to-Broke model. 4.2K views · 26 likes · 0 reposts · 1 replies Open on X →
1) Scarcity drives monetary value. Stock-to-Flow (S2F) = existing supply ÷ annual new production. Gold sits at ~60. Industrial metals are far lower. Bitcoin’s fixed 21 million + predictable issuance makes its S2F uniquely measurable: ~120 and rising. 42.8K views · 162 likes · 8 reposts · 6 replies Open on X →
Most people stare at Bitcoin charts. Stock-to-Flow models scarcity. Here are the 10 highest-value S2F insights, the ones that actually change how you think about money. Thread 🧵 285.7K views · 1.2K likes · 120 reposts · 87 replies Open on X →
#Bitcoin is dead. Bubble. Death spiral 🤣🤣🤣 Guess who is buying now, like 2012 and 2015-2016? https://t.co/jAj85x4DOE
0 views · 447 likes · 70 reposts · 22 replies Open on X →

Against accounts of the same size

28 posts from the last 90 days, next to the 1M–10M follower range. shown to more people than peers of the same size.

Median views77 892this account14 648median for 1M–10M
Reach, %3.60%this account0.74%median for 1M–10M
Engagement, %0.66%this account0.70%median for 1M–10M
MetricThis accountMedian for 1M–10MRatio
Median views per post77 89214 6485.32×
Reach (views ÷ followers)3.60%0.74%4.86×
Engagement rate0.66%0.70%0.94×

Others in this range →   Compare with another account →   How these benchmarks are built →

Growth & engagement

How the posts we collected actually performed: views and reaction rate post by post, what the audience did with them, and where the follower count goes.

Views per post

6.6K25 Aug
5.2K
252.9K1 Sep
141.4K
287.9K5 Sep
390K7 Sep
256.1K12 Sep
353.6K14 Sep
158.1K17 Sep
189K19 Sep
203.6K21 Sep
271.9K22 Sep
113K
319.1K23 Sep

Last 14 collected posts, oldest on the left. The scale is logarithmic: one post can outrun the rest a hundred times over.

Engagement rate per post

0.62%25 Aug
0.39%
2.02%1 Sep
0.37%
0.85%5 Sep
1.38%7 Sep
1.15%12 Sep
1.32%14 Sep
0.92%17 Sep
1.74%19 Sep
1.81%21 Sep
1.42%22 Sep
1.04%
1.47%23 Sep

Reactions — likes, reposts, replies and quotes — divided by views. Median for 1M–10M accounts is 0.70%.

What the audience does

Likes75.6%40 085 in total
Reposts7.5%3 975 in total
Replies3.6%1 920 in total
Quotes0.6%293 in total
Bookmarks12.8%6 783 in total

Share of every reaction we collected for this account. Replies mean argument, reposts mean endorsement, bookmarks mean the post was worth keeping.

Followers by day

22 Sep

Daily snapshots since 22 Sep 2026; the dashed line is the starting count.

Similar accounts