tweetindex
EN

Alexey Grigorev ✓

@Al_Grigor · Build and ship together: · joined 20 Jan 2020

Founder @DataTalksClub | Teaching engineers to build production AI systems | AI agents, LLMs, ML, data engineering | 100,000+ learners

29 670Followers
431Following
8 029Posts total
36.5KViews on collected posts

Latest posts

I hope I'll be able to do the same with .claude soon too https://t.co/1grVEyOi0A
893 views · 7 likes · 0 reposts · 0 replies Open on X →
I built a Django to-do app in one prompt. Cost: less than $1. Here's what the coding agent did: 1. Created the project structure - Generated Django project and app - Set up settings and URLs - Configured Tailwind CSS for styling 2. Built the data model - Created a Todo model
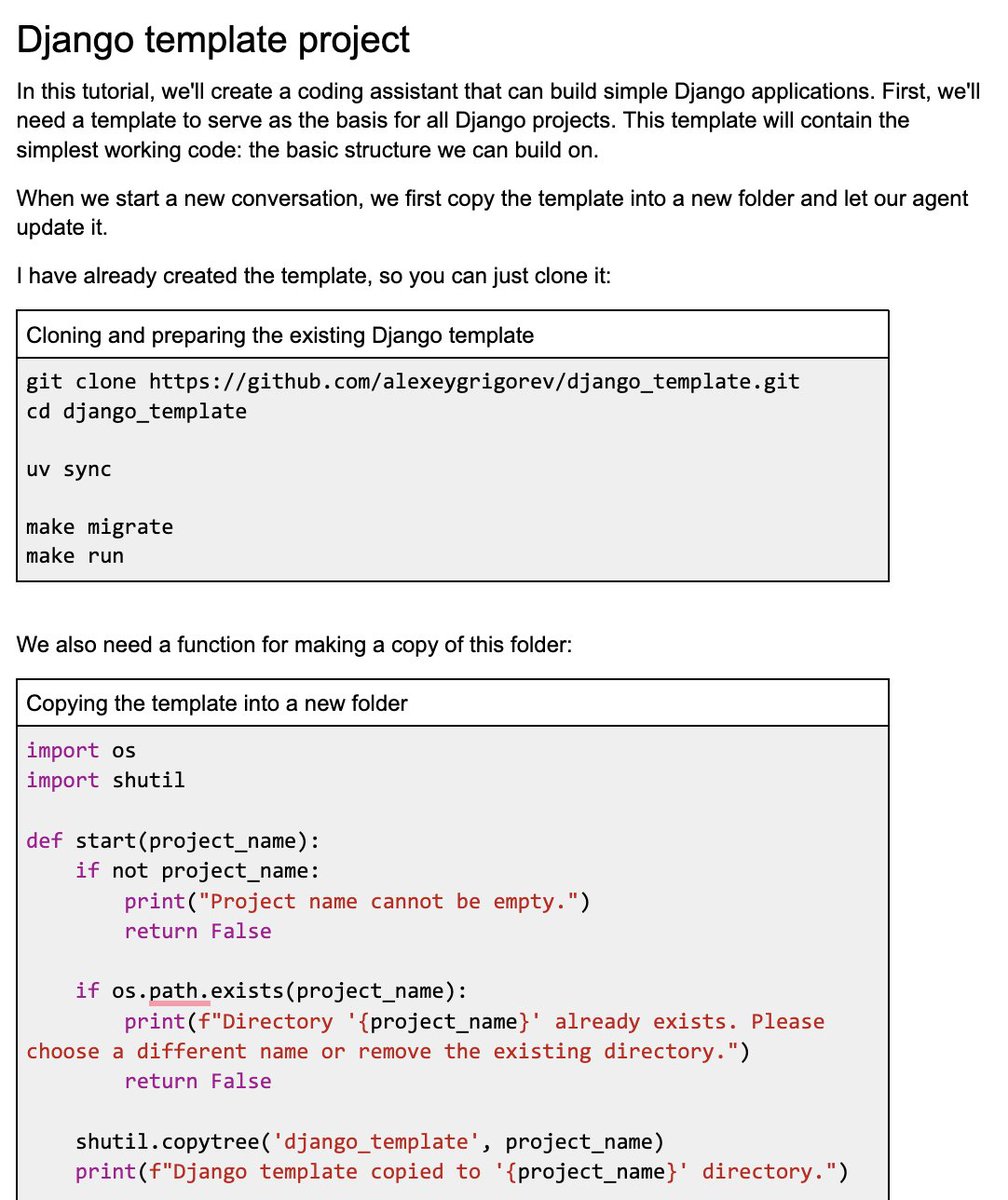
A tutorial outlines steps to clone a Django template, including commands for setup, migration, and running a project.
1.1K views · 21 likes · 4 reposts · 8 replies Open on X →
How about .agents for skills? 1.8K views · 5 likes · 0 reposts · 0 replies Open on X →
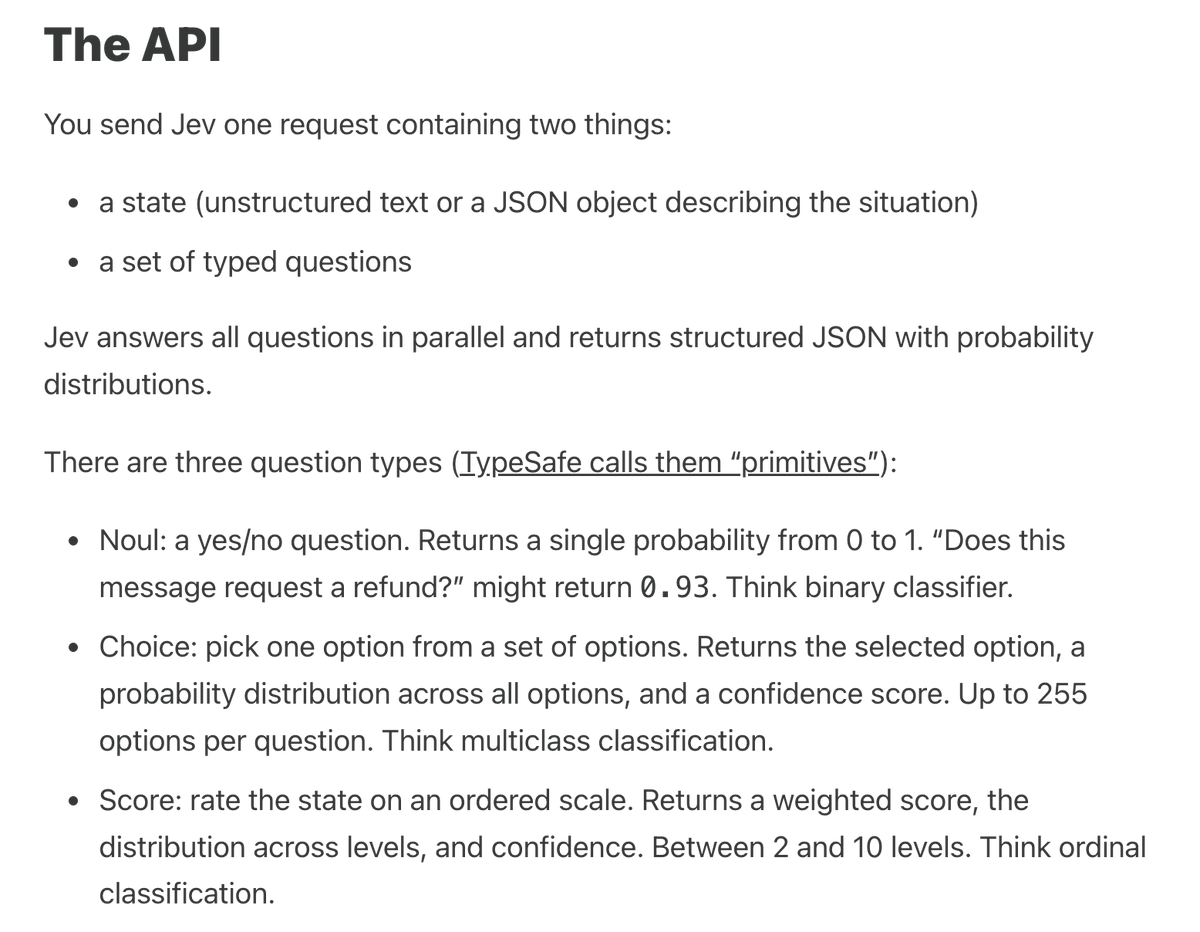
Jev is a new kind of model that doesn't generate text. It only makes decisions. You send it a state (text or JSON) plus a set of typed questions, and it returns structured JSON with probability distributions. I replaced my gpt-4o-mini setup for routing tasks to my 3 agents and
Text outlines an API for a model named Jev, detailing inputs, question types, and outputs involving structured JSON and probability distributions.
Benchmark results comparing Jev's performance across four workflows including accuracy, cost, latency, and nearest competitors.
Flowchart showing a user request processed by Jev, directing tasks to DataTalks.Club, AI Shipping Labs, or admin based on criteria.
A comparison of two routing models, Jev and gpt-4o-mini, showcasing their request accuracy and latency metrics in a structured table.
1.2K views · 23 likes · 1 reposts · 6 replies Open on X →
@Al_Grigor i am currently working on enterprise data analysis agent, pretty interesting. https://t.co/QjpgQfMaJ7 282 views · 1 likes · 0 reposts · 0 replies Open on X →
If you found this post helpful, follow me for more content like this. I publish a weekly newsletter where I share practical insights on data and AI. It focuses on projects I'm working on + interesting tools and resources I've recently tried: https://t.co/oh7DBWuGEE 793 views · 4 likes · 0 reposts · 1 replies Open on X →
So you follow one evolving system, practice on separate mini-projects, explore other examples, and build something of your own in parallel. That is the core of Buildcamp. The course starts in less than 5 days. You can sign up for the course here: https://t.co/REMfPMnikB https:/
A man gesturing while presenting the AI Engineering Buildcamp course details, including ratings and enrollment information.
1.1K views · 6 likes · 1 reposts · 0 replies Open on X →
Optional projects: 8. FAQ Assistant: Add search integrations and turn it into a support chatbot. 9. YouTube Transcript Summarizer: A system that extracts summaries and chapter structure from YouTube videos using structured output. 10. PDF Book Processor: Similar tasks often ht
A grid of application features focuses on various tools for summarizing YouTube content, processing PDFs, and conducting research analysis.
1.2K views · 4 likes · 0 reposts · 1 replies Open on X →
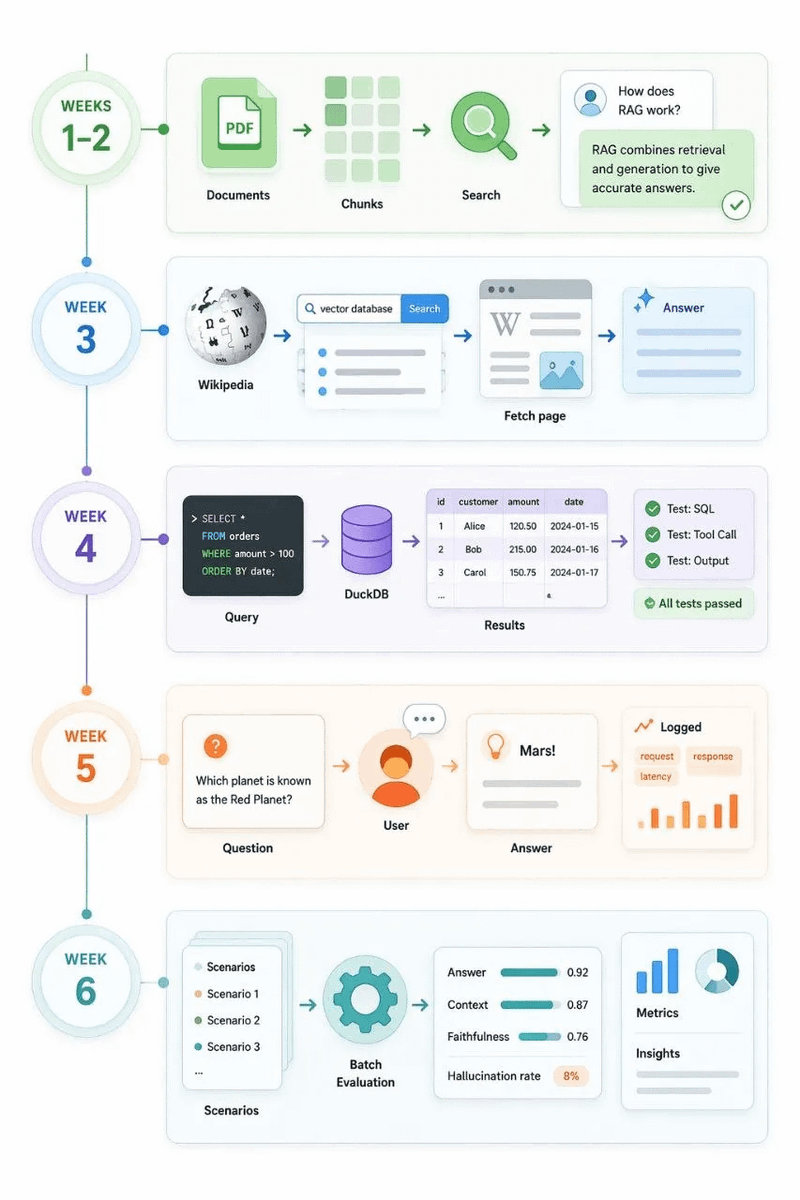
Homework projects: 3. Document processing with AI. You download books, extract PDF text, chunk documents, and build a full RAG pipeline. 4. Wikipedia Agent. You implement search and page-fetching tools and build an agent using a framework of your choice. 5. Testing and https:/
Workflow diagram outlines a six-week AI project, covering document processing, Wikipedia integration, SQL querying, user interaction, and evaluation metrics.
1.1K views · 4 likes · 0 reposts · 1 replies Open on X →
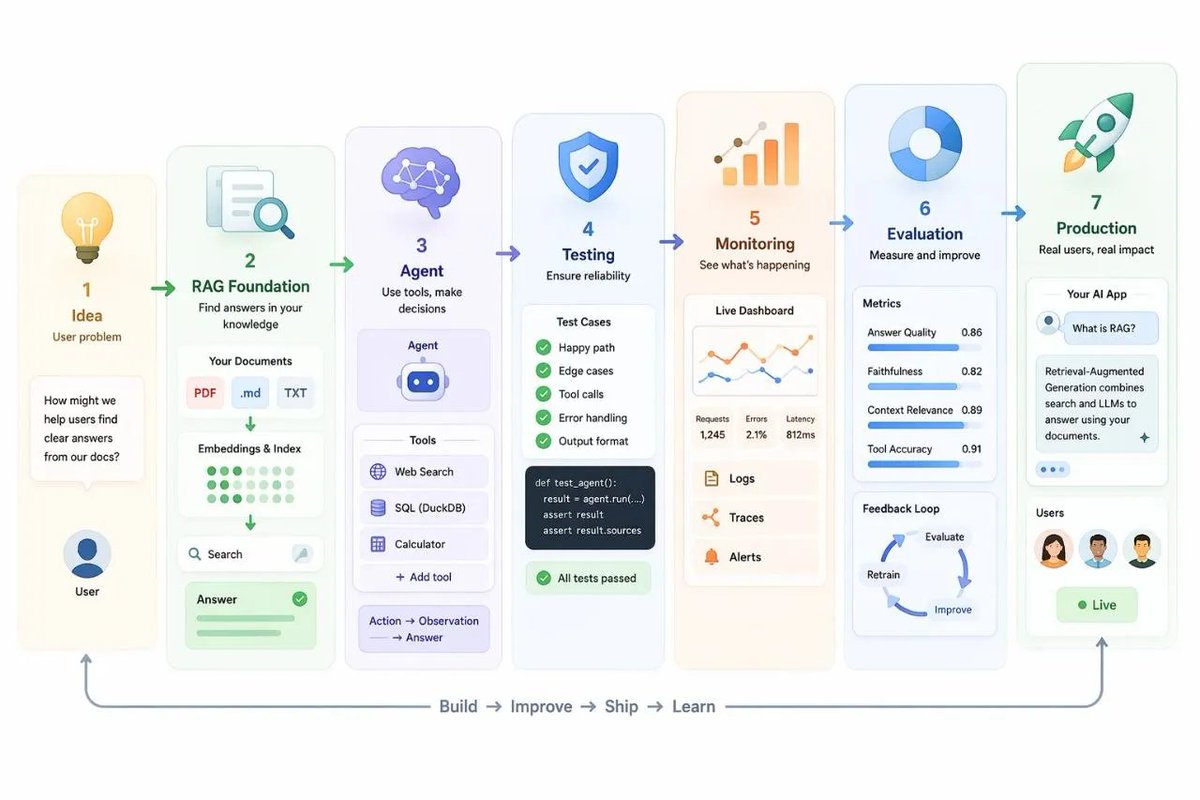
2. Capstone project Your own AI application, built step by step during the course, from first RAG version to a more complete system with tools, testing, monitoring, evaluation, and deployment. https://t.co/6dYwGSnjWZ
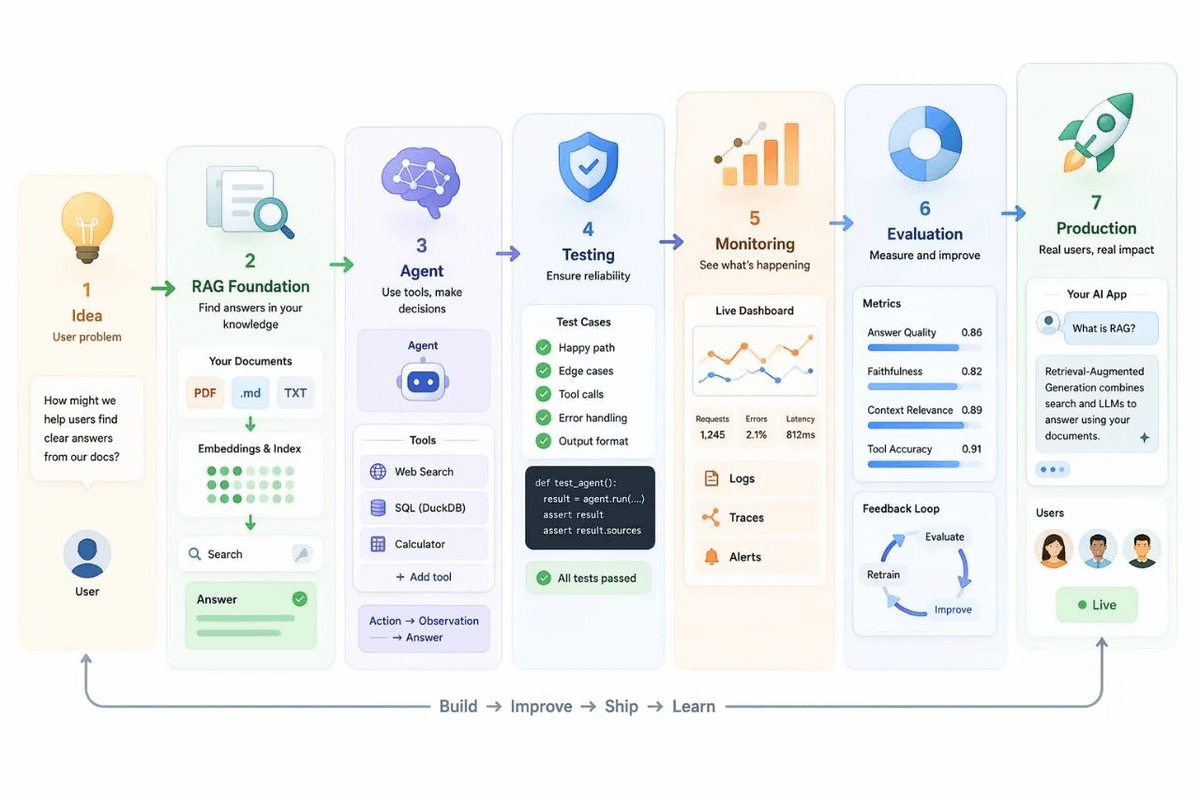
Flowchart outlines steps to build an AI application, from idea generation to deployment, including testing, monitoring, and evaluation.
1.3K views · 7 likes · 1 reposts · 1 replies Open on X →
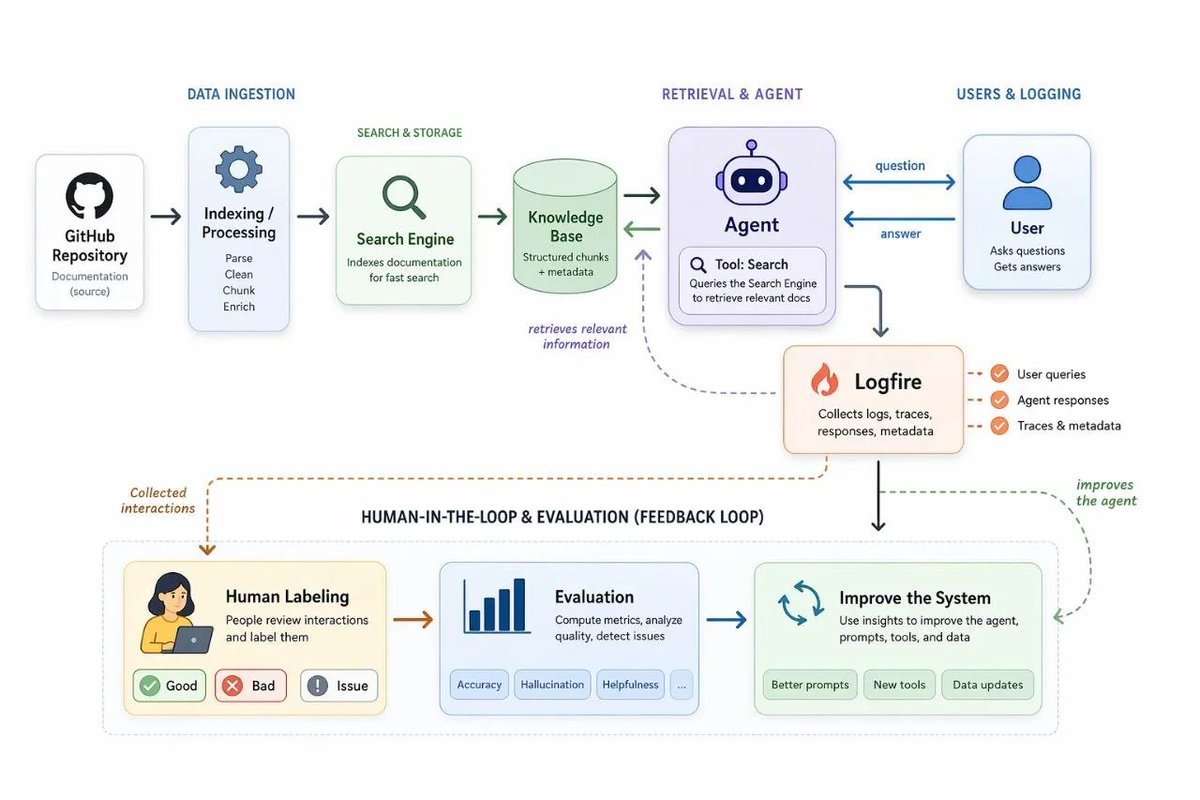
1. A running example project A Documentation Agent that evolves throughout the course. It starts as a RAG system and gradually becomes an agent that is tested, monitored, and evaluated. https://t.co/62CSPLgE4j
Flowchart depicting a documentation agent workflow, illustrating data ingestion, retrieval, user interaction, and feedback for system improvement.
1.5K views · 7 likes · 0 reposts · 2 replies Open on X →
AI Engineering Buildcamp is project-driven. You learn AI engineering by building. 15 projects you can build during the course 👇🏼 (You get lifetime access to the course if you sign up) https://t.co/VUDgEMhMLG
Flowchart illustrating the data processing pipeline for AI development, highlighting ingestion, search, user interaction, and evaluation processes.
A flowchart outlines steps in AI project development, covering idea generation, RAG foundation, testing, monitoring, evaluation, and production.
A flowchart outlines a six-week AI engineering course focused on project-based learning, featuring tasks like document search and query evaluation.
Nine panels display various AI tools like a YouTube summarizer, coding agent, and PDF processor, showcasing project-driven features for learning.
24.2K views · 371 likes · 74 reposts · 9 replies Open on X →

Against accounts of the same size

4 posts from the last 90 days, next to the 10K–100K follower range. right around the median for its follower range.

Median views1 130this account924median for 10K–100K
Reach, %3.81%this account3.62%median for 10K–100K
Engagement, %1.69%this account1.52%median for 10K–100K
MetricThis accountMedian for 10K–100KRatio
Median views per post1 1309241.22×
Reach (views ÷ followers)3.81%3.62%1.05×
Engagement rate1.69%1.52%1.11×

Others in this range →   Compare with another account →   How these benchmarks are built →

Growth & engagement

How the posts we collected actually performed: views and reaction rate post by post, what the audience did with them, and where the follower count goes.

Views per post

24.2K9 Apr
1.5K
1.3K
1.1K
1.2K
1.1K
793
28210 Apr
1.2K18 Sep
1.8K
1.1K19 Sep
893

Last 12 collected posts, oldest on the left. The scale is logarithmic: one post can outrun the rest a hundred times over.

Engagement rate per post

1.87%9 Apr
0.61%
0.68%
0.45%
0.42%
0.63%
0.63%
0.35%10 Apr
2.59%18 Sep
0.33%
3.00%19 Sep
0.78%

Reactions — likes, reposts, replies and quotes — divided by views. Median for 10K–100K accounts is 1.52%.

What the audience does

Likes41.4%460 in total
Reposts7.3%81 in total
Replies2.6%29 in total
Quotes0.1%1 in total
Bookmarks48.6%540 in total

Share of every reaction we collected for this account. Replies mean argument, reposts mean endorsement, bookmarks mean the post was worth keeping.

The follower curve appears once this account has two daily snapshots — we take one a day, and this one is on its first.

Similar accounts