tweetindex
EN

Mark D. Levine

@MarkLevineNYC · New York, NY · joined 03 Nov 2008

Comptroller of New York City.

105 224Followers
5 255Following
25 162Posts total
119.9KViews on collected posts

Latest posts

Ahead of Labor Day, my office is publishing an updated tool that lets you track which NYC employers have been caught violating workers’ rights. Our 2026 Employer Violations Dashboard covers everything from workplace safety to wage theft—and lets you search by employer or 5.5K views · 20 likes · 6 reposts · 10 replies Open on X →
NYC has an increasingly K-shaped economy https://t.co/HA7JnbLMMx
2:22
5.9K views · 63 likes · 8 reposts · 7 replies Open on X →
@MarkLevineNYC This is largely because the city provides generous benefits and subsidies to the poor (inc. rent control and public housing), while making life increasingly unaffordable for middle class families. Therefore middle class moves out, rich and poor stay = higher inequa 625 views · 64 likes · 1 reposts · 6 replies Open on X →
You can read our full report on trends in personal income and wage Inequality in NYC here: https://t.co/b2eUDQKzM5 1.7K views · 18 likes · 1 reposts · 6 replies Open on X →
For the bottom 90% of earners in NYC, income growth has not keep pace with inflation. Between 2019 and 2024, real median income fell 3.2%, while average real income for the bottom 90% was essentially unchanged. Only the top two income deciles saw meaningful real income gains. 1.9K views · 22 likes · 1 reposts · 4 replies Open on X →
The growing inequality in NYC has been driven by the fact that returns on capital have grown at a much faster rate than income from employment. Capital gains, dividends, interest, business income, rents, and other non-wage sources make up a much larger share of income at the top 1.8K views · 23 likes · 2 reposts · 6 replies Open on X →
These trends were even more pronounced in the highest income echelons. In 2024, the top 1% of NYC households received 37% of all income in the city, compared with 22% nationally. The top 0.1% (about 5,000 households) received 22% of all NYC income, approximately double what is
2.5K views · 24 likes · 3 reposts · 3 replies Open on X →
Today my office is releasing a major new analysis of income inequality in NYC. We found that NYC has grown considerably more unequal since 2019. Nearly two-thirds of real income growth went to the top 1%, while median income actually fell after inflation and the bottom 90% saw h
64.6K views · 300 likes · 107 reposts · 106 replies Open on X →
John Galiano said "I love Hitler" and told people their families would have been "gassed", among other vile antisemitic statements. Artistic genius is no excuse for bigotry. And bigotry should not be honored. Not at the Met Gala or anywhere. I am relieved this error has been 30.1K views · 262 likes · 22 reposts · 36 replies Open on X →
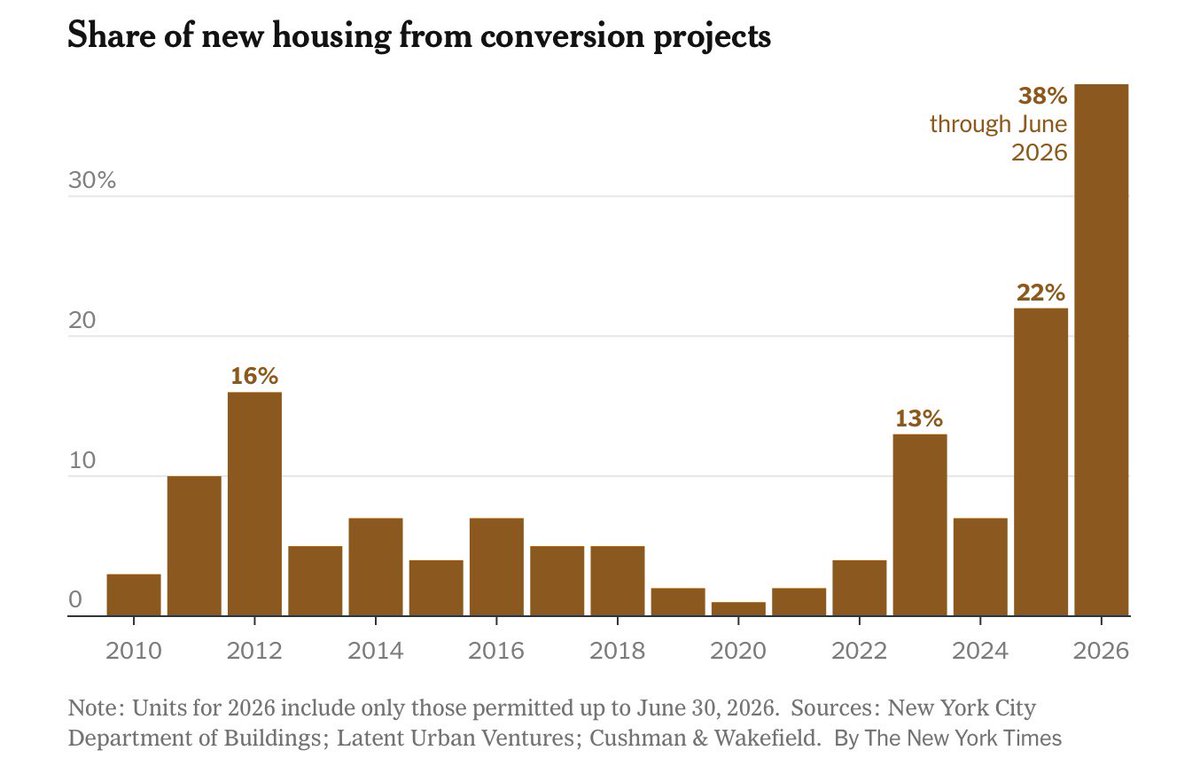
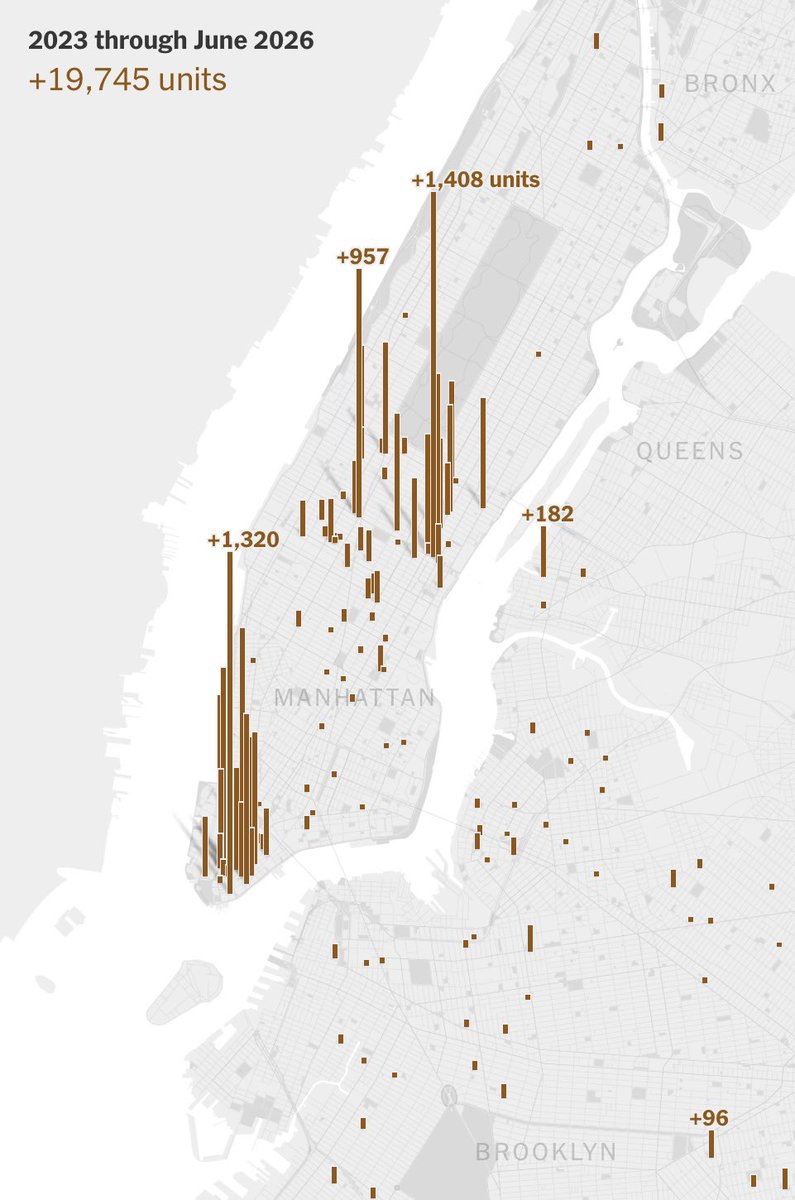
When two steel columns buckled on the former Pfizer building in July it threatened to stop office-to-residential conversions citywide. New NYT analysis shows just what a disaster it would be if all conversions are stopped. There are more than 100 projects underway around the htt
5.2K views · 97 likes · 4 reposts · 12 replies Open on X →

Against accounts of the same size

10 posts from the last 90 days, next to the 100K–1M follower range. shown to more people than peers of the same size.

Median views3 869this account4 785median for 100K–1M
Reach, %3.68%this account1.71%median for 100K–1M
Engagement, %1.39%this account1.26%median for 100K–1M
MetricThis accountMedian for 100K–1MRatio
Median views per post3 8694 7850.81×
Reach (views ÷ followers)3.68%1.71%2.15×
Engagement rate1.39%1.26%1.10×

Others in this range →   Compare with another account →   How these benchmarks are built →

Growth & engagement

How the posts we collected actually performed: views and reaction rate post by post, what the audience did with them, and where the follower count goes.

Views per post

5.2K30 Aug
30.1K31 Aug
64.6K2 Sep
2.5K
1.8K
1.9K
1.7K
625
5.9K3 Sep
5.5K4 Sep

Last 10 collected posts, oldest on the left. The scale is logarithmic: one post can outrun the rest a hundred times over.

Engagement rate per post

2.19%30 Aug
1.08%31 Aug
0.84%2 Sep
1.22%
1.73%
1.42%
1.50%
11.36%
1.35%3 Sep
0.70%4 Sep

Reactions — likes, reposts, replies and quotes — divided by views. Median for 100K–1M accounts is 1.26%.

What the audience does

Likes63.2%893 in total
Reposts11.0%155 in total
Replies13.9%196 in total
Quotes2.7%38 in total
Bookmarks9.3%132 in total

Share of every reaction we collected for this account. Replies mean argument, reposts mean endorsement, bookmarks mean the post was worth keeping.

The follower curve appears once this account has two daily snapshots — we take one a day, and this one is on its first.

Similar accounts