tweetindex
EN

NWS Las Vegas

@NWSVegas · Las Vegas, NV · joined 30 May 2012

Official X account for the National Weather Service covering southern Nevada, northwestern Arizona, & southeastern California. Details: https://t.co/OftT8ETh8k

61 132Followers
558Following
37 165Posts total
18.1KViews on collected posts

Latest posts

A few showers and thunderstorms are possible this afternoon over the eastern Sierra. Otherwise, warm and dry conditions are on tap for the rest of the forecast area. #NVwx #AZwx #CAwx https://t.co/rxV7FiRopg
Graphic depicts a cartoon of an isolated thunderstorm over a mountain range, along with daily highs for select locations across the area. In Las Vegas it will be 105 degrees, in Bishop it will be 96 degrees, in Barstow it will be 102 degrees, in Death Valley it will be 114 degrees, in Needles it will be 110 degrees, and in Kingman it will be 100 degrees. A few showers and thunderstorms are possible this afternoon over the eastern Sierra.
2K views · 31 likes · 5 reposts · 1 replies Open on X →
Temps will continue to climb through the week, peaking on Thursday, with highs within 3°F of daily records. 🌡️ Late-season heat is dangerous, as your body is exhausted from fighting heat all summer. 🚰 Hydrate & save recreation to the cooler parts of the day on Thursday! https://
Late-Season Extreme Heat Warning. The warning covers Death Valley, the Las Vegas Valley, the Pahrump Valley, the Moapa Valley, the Colorado River Valley, southern Mohave County, and southeastern San Bernardino County. Why is there an Extreme Heat Warning for Thursday when temperatures this summer were much hotter? Late-season heat can be very dangerous. Not only are locals exhausted from fighting the heat all summer, but tourists are more likely to be traveling from much cooler temperatures. Historically, there has been a resurgence of heat-related impacts from well-above-normal temperatures in September, so be sure to hydrate and eat light meals!
2.6K views · 53 likes · 8 reposts · 6 replies Open on X →
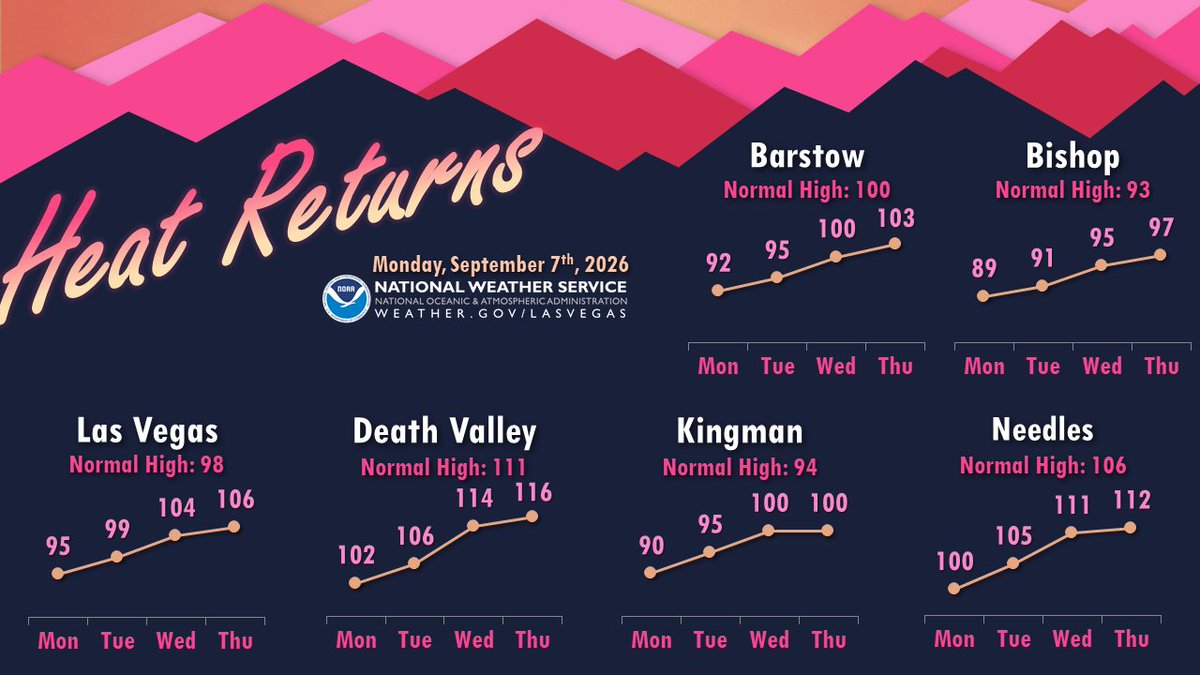
Temperatures heat back up to above-normal mid-week, with afternoon highs peaking on Thursday. ☀️🌡️ #VegasWeather https://t.co/qCHtqUaRxN
Heat Returns. Las Vegas. Normal High 98. Monday 95. Tuesday 99. Wednesday 104. Thursday 106. Death Valley. Normal High 111. Monday 102. Tuesday 106. Wednesday 114. Thursday 116. Kingman. Normal High 94. Monday 90. Tuesday 95. Wednesday 100. Thursday 100. Needles. Normal High 106. Monday 100. Tuesday 105. Wednesday 111. Thursday 112. Barstow. Normal High 100. Monday 92. Tuesday 95. Wednesday 100. Thursday 103. Bishop. Normal High 93. Monday 89. Tuesday 91. Wednesday 95. Thursday 97.
2.7K views · 42 likes · 4 reposts · 3 replies Open on X →
⚠️Flood Advisory 📍SE San Bernardino County - Twentynine Palms, Yucca Valley, Joshua Tree, and Morongo Valley ⏰Until 7:15 PM PDT 💧Persistent moderate rainfall is expected to produce localized flooding and ponding of low-lying areas. Don't drive through floodwaters! #cawx https:/
3.2K views · 22 likes · 1 reposts · 0 replies Open on X →
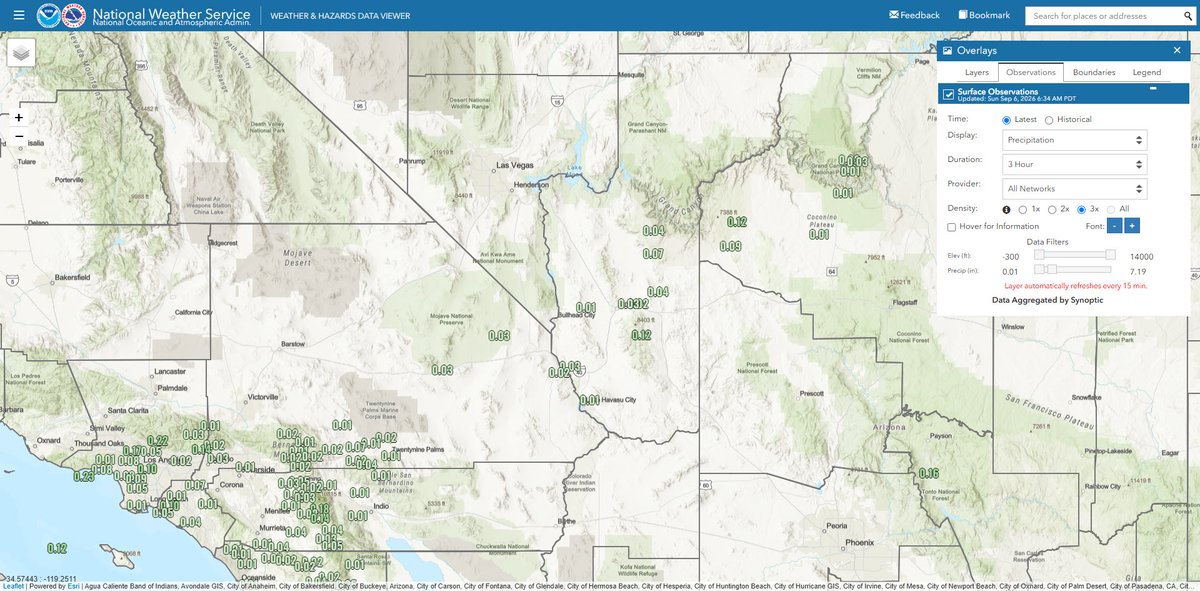
Zooming in, we can see the band of precipitation slowly drifting northward. We are expecting it to set up broadly along the I-15 corridor later this morning and into the afternoon. Rainfall amounts in our area have been light, with all gauges below 0.15" as of 630 AM. https://t.
0:16
1.8K views · 25 likes · 4 reposts · 2 replies Open on X →
Satellite Update! | 6:30am ☔️🌧️📡 Hurricane Lowell, Tropical Storm Karina, & Hurricane Marie are churning in the eastern Pacific. While Marie is not expected to approach the US, you can see moisture from the storm is pushing into the Desert SW, bringing us rain today. #VegasWx ht
Map showing the eastern Pacific Ocean. Hurricane Lowell is pictured west of Hawaii. Tropical Storm Karina is placed between Hawaii and the United States. Hurricane Marie is southwest of Baja California. You can see moisture from Marie being ushered into the Desert Southwest.
5.7K views · 85 likes · 12 reposts · 1 replies Open on X →

Against accounts of the same size

6 posts from the last 90 days, next to the 10K–100K follower range. shown to more people than peers of the same size.

Median views2 650this account922median for 10K–100K
Reach, %4.34%this account3.42%median for 10K–100K
Engagement, %1.75%this account1.53%median for 10K–100K
MetricThis accountMedian for 10K–100KRatio
Median views per post2 6509222.87×
Reach (views ÷ followers)4.34%3.42%1.27×
Engagement rate1.75%1.53%1.15×

Others in this range →   Compare with another account →   How these benchmarks are built →

Growth & engagement

How the posts we collected actually performed: views and reaction rate post by post, what the audience did with them, and where the follower count goes.

Views per post

5.7K6 Sep
1.8K
3.2K
2.7K7 Sep
2.6K8 Sep
2K9 Sep

Last 6 collected posts, oldest on the left. The scale is logarithmic: one post can outrun the rest a hundred times over.

Engagement rate per post

1.71%6 Sep
1.72%
0.71%
1.79%7 Sep
2.62%8 Sep
1.85%9 Sep

Reactions — likes, reposts, replies and quotes — divided by views. Median for 10K–100K accounts is 1.53%.

What the audience does

Likes83.2%258 in total
Reposts11.0%34 in total
Replies4.2%13 in total
Bookmarks1.6%5 in total

Share of every reaction we collected for this account. Replies mean argument, reposts mean endorsement, bookmarks mean the post was worth keeping.

The follower curve appears once this account has two daily snapshots — we take one a day, and this one is on its first.

Similar accounts