tweetindex
EN

Pitcher List Stats

@PitcherListPLV · joined 29 Dec 2022

The home of Pitcher List Stats - Analytics branch of @PitcherList

115 788Followers
15Following
5 132Posts total
424.9KViews on collected posts

Latest posts

Keider Montero (DET) allowed a pair of earned runs in four innings against Minnesota https://t.co/vlfZbM6lR3
Keider Montero (DET) allowed a pair of earned runs in four innings against Minnesota
3.3K views · 0 likes · 0 reposts · 0 replies Open on X →
Brady Basso (ATH) struck out four over four shutout innings against the Blue Jays https://t.co/r0WoFmF0Ac
Brady Basso (ATH) struck out four over four shutout innings against the Blue Jays
3.4K views · 0 likes · 1 reposts · 0 replies Open on X →
Michael Lorenzen (TOR) allowed a pair of earned runs in 2.2 innings as the follower against the A's https://t.co/5IsWuIS3nK
Michael Lorenzen (TOR) allowed a pair of earned runs in 2.2 innings as the follower against the A's
3.2K views · 0 likes · 1 reposts · 0 replies Open on X →
Zebby Matthews (MIN) walked four and allowed five earned runs over 2.1 innings against the Tigers https://t.co/5oUM7RFi0B
Zebby Matthews (MIN) walked four and allowed five earned runs over 2.1 innings against the Tigers
3.3K views · 0 likes · 0 reposts · 0 replies Open on X →
Continuing the conversation about our game score, @blandalytics and Pitcher List Senior Analyst @_nateschwartz go over Kyle's article on the latest episode of their podcast, The Approach Angle! https://t.co/upA7vRAPlB 5.8K views · 1 likes · 0 reposts · 0 replies Open on X →
@PitcherListPLV @PitcherList @blandalytics Keep it up, I do really enjoy looking at these after starts, minor tweaks like the responses said but very very impressive 152 views · 4 likes · 0 reposts · 0 replies Open on X →
Thank you all, as always, for the support on our cards! We are continuing to work and fine-tune them to keep improving them, and will be sure to relay updates as they happen! 3.5K views · 3 likes · 0 reposts · 0 replies Open on X →
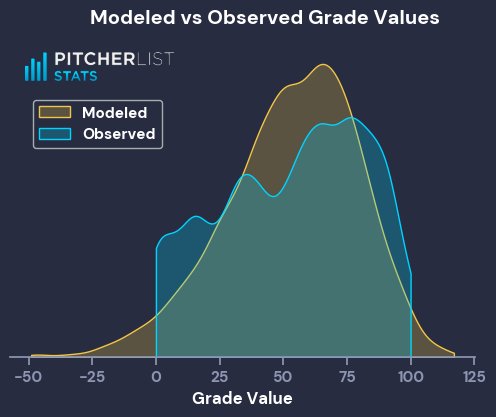
At the end of this process, we landed at our game score formula. GS= 30+8*IP-7*ER+2*SO-2*BB-H-HR This formula gives the following distribution of Grade/Game Score Values: https://t.co/F8zmbbtyNB
287 views · 2 likes · 0 reposts · 1 replies Open on X →
The modeled Game Scores have a more peaked distribution, centered around the observed average, and have longer tails to the distribution. That’s expected behavior for the output of a simple linear model. We now have our crowd-sourced Game Score. 215 views · 1 likes · 0 reposts · 1 replies Open on X →
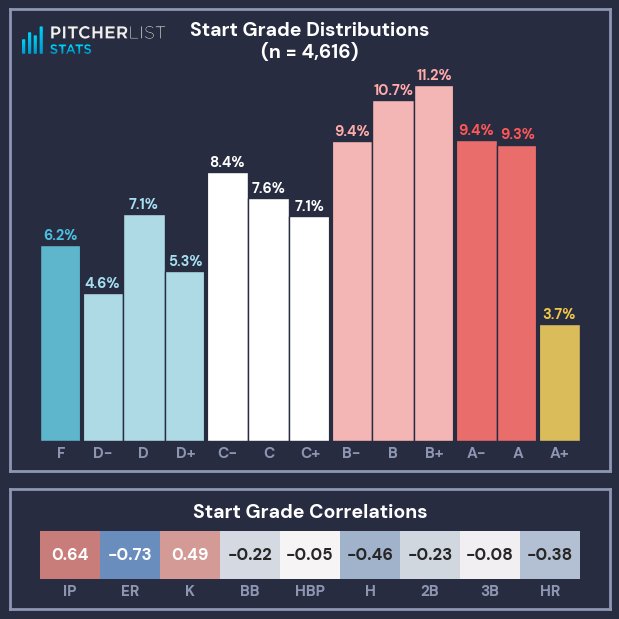
With the Game Score formula finalized, we can now apply it to the entire population of 2022-2025 starts, to properly group them into grades. A few guiderails were set up: - A+ needs to be scarce (<4% of starts) - F should be roughly 6% - B’s should be the most common https://t.c
3.7K views · 2 likes · 0 reposts · 1 replies Open on X →
Now for the Game Score. We dropped HBP and 3B due to their weak correlations, and decided to leave out 2B to keep this game score representative of the box score data on our player cards. Extreme outlier grades were also removed based on expected modeling scores https://t.co/I
737 views · 2 likes · 0 reposts · 1 replies Open on X →
It was important that the distribution of stats from the crowd-graded sample of starts is close to the distribution from the broader population (2022-2025). With Q-Q Plots, we can compare that. We want the dots of the scatterplot to line up closely with the dotted line. https:/
896 views · 2 likes · 0 reposts · 1 replies Open on X →
A🧵of info from the article by @blandalytics: The results of our polling: - A+ was very rare - Median grade was a B- - Most bad starts were graded as a D or F, very few D- or D+ - IP ran a strong correlation to the grade, while ER had an even stronger inverse correlation https:/
188K views · 48 likes · 4 reposts · 5 replies Open on X →
"How good was that start?" With our game score app from around a month ago, we received over 4,500 responses, and @blandalytics has put together an article showing how that came together to make the grade you see on our player cards! https://t.co/hvTXY7h71A 208.4K views · 18 likes · 2 reposts · 0 replies Open on X →

Against accounts of the same size

4 posts from the last 90 days, next to the 100K–1M follower range. shown widely, but few of those viewers react.

Median views3 306this account6 070median for 100K–1M
Reach, %2.86%this account1.60%median for 100K–1M
Engagement, %0.01%this account0.97%median for 100K–1M
MetricThis accountMedian for 100K–1MRatio
Median views per post3 3066 0700.54×
Reach (views ÷ followers)2.86%1.60%1.78×
Engagement rate0.01%0.97%0.01×

Others in this range →   Compare with another account →   How these benchmarks are built →

Growth & engagement

How the posts we collected actually performed: views and reaction rate post by post, what the audience did with them, and where the follower count goes.

Views per post

208.4K5 May
188K
896
737
3.7K
215
287
3.5K
152
5.8K8 May
3.3K9 Sep
3.2K
3.4K
3.3K

Last 14 collected posts, oldest on the left. The scale is logarithmic: one post can outrun the rest a hundred times over.

Engagement rate per post

0.01%5 May
0.03%
0.33%
0.41%
0.08%
0.93%
1.05%
0.08%
2.63%
0.02%8 May
0.00%9 Sep
0.03%
0.03%
0.00%

Reactions — likes, reposts, replies and quotes — divided by views. Median for 100K–1M accounts is 0.97%.

What the audience does

Likes61.9%83 in total
Reposts6.0%8 in total
Replies7.5%10 in total
Bookmarks24.6%33 in total

Share of every reaction we collected for this account. Replies mean argument, reposts mean endorsement, bookmarks mean the post was worth keeping.

The follower curve appears once this account has two daily snapshots — we take one a day, and this one is on its first.

Similar accounts