tweetindex
EN

Robert Prechter ✓

@RobertPrechter · joined 02 Feb 2011

Author of 18 books incl. bestsellers Conquer the Crash & Elliott Wave Principle. Personal tweets signed -RP. Managed by @elliottwaveintl. RT ≠ endorsement.

16 914Followers
76Following
640Posts total
129.5KViews on collected posts

Latest posts

@RobertPrechter Nope https://t.co/hUh0o0CROz
19 views · 0 likes · 0 reposts · 0 replies Open on X →
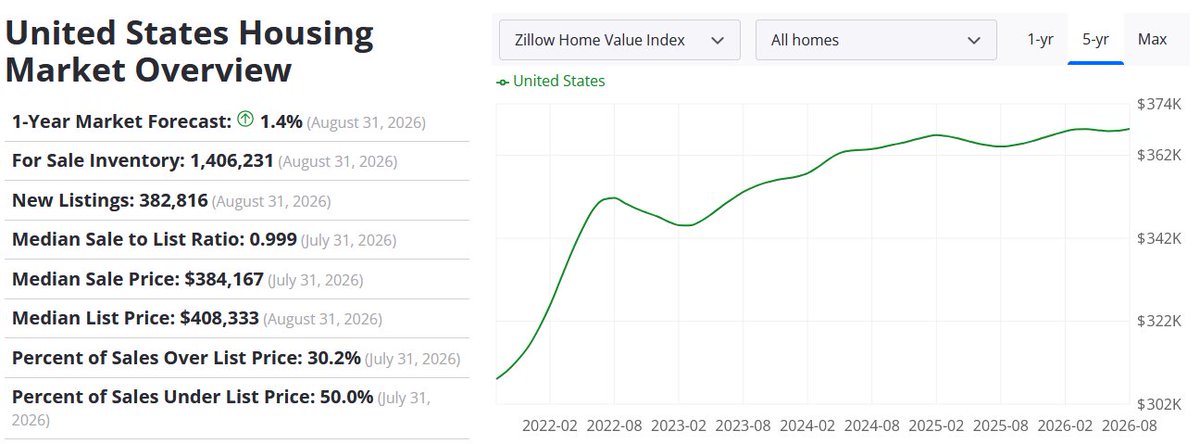
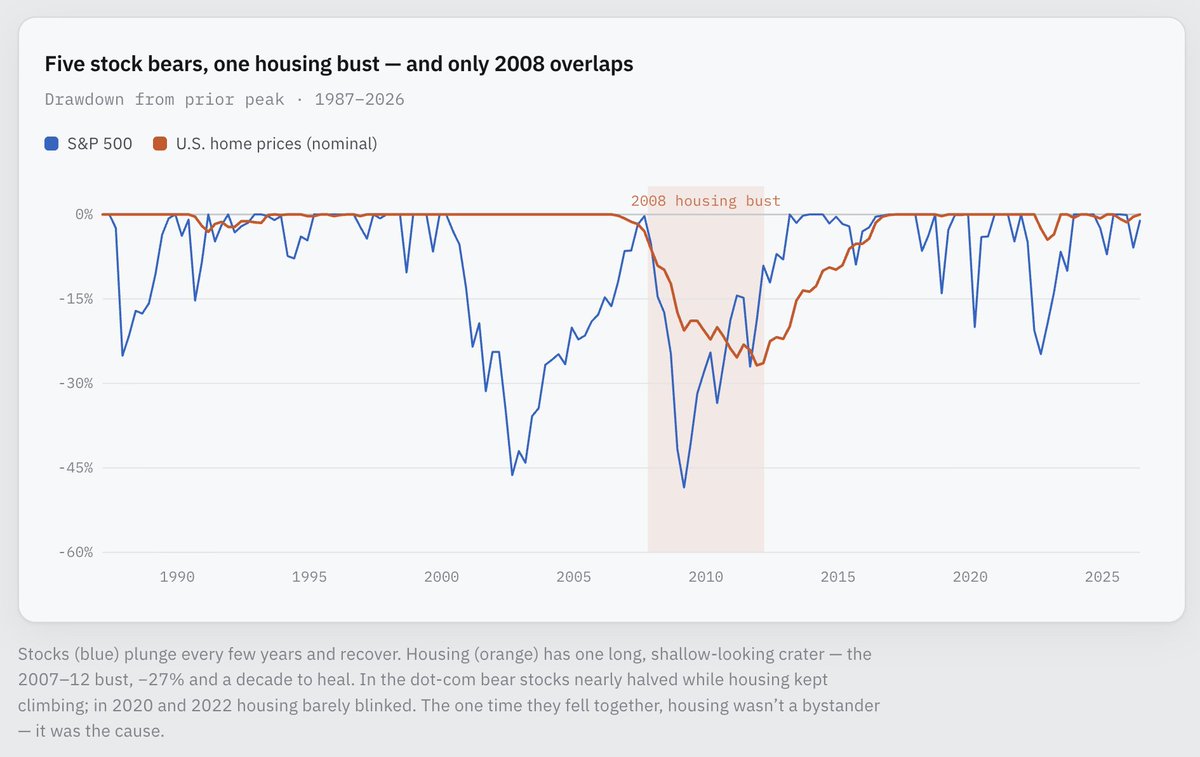
@RobertPrechter Not disagreeing necessarily but the link between the stock market and the housing market isn't strong. https://t.co/oxHXIMQrQx https://t.co/ataiGqJm5v
98 views · 2 likes · 1 reposts · 0 replies Open on X →
@RobertPrechter Hold on Bob not yet https://t.co/h0Nr8JY9JS
140 views · 2 likes · 0 reposts · 0 replies Open on X →
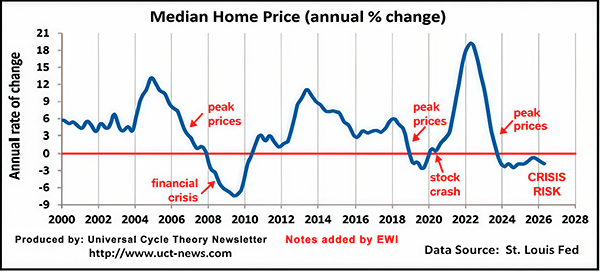
Real estate prices are already slipping. After real estate prices topped in 2006, the stock market peaked in 2007 and crashed in 2008. After real estate prices topped in 2019, stocks peaked and crashed in 2020. The latest real estate boom ended in 2023, so the risk in property
7.8K views · 81 likes · 32 reposts · 7 replies Open on X →
@RobertPrechter https://t.co/wSm4fQo1SS 368 views · 1 likes · 0 reposts · 0 replies Open on X →
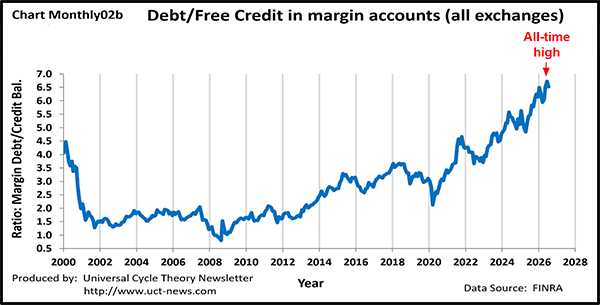
@RobertPrechter Robert Prechter links record-high margin debt to free credit balances (ratio at 6.8 versus 0.8 in 2009) directly to the DJIA’s 8.5x rise over that period, arguing leverage has fueled extreme valuations. • The attached chart from the Universal Cycle Theory Newslet 115 views · 1 likes · 0 reposts · 0 replies Open on X →
@RobertPrechter Ponzi smiled 429 views · 2 likes · 0 reposts · 0 replies Open on X →
How did valuations get so crazy? Borrowing to buy. Margin debt relative to free credit balances in brokerage accounts has reached an all-time high of 6.8. In 2009, it was about 0.8. From 2009 to 2026, the DJIA rose 8.5x - which precisely matches the 8.5x multiple of the margin
35.1K views · 221 likes · 67 reposts · 10 replies Open on X →
So it was still an up week (S&P 500 +0.67%, NASDAQ +1.94%) after the Fed and the BoJ raised rates, but look what lies ahead. Get ready for the Mid-October Trough. https://t.co/31BBiiX3uO #investmentstrategy #financialmarkets #finance #economics https://t.co/eEn7wRZLRI
8.7K views · 6 likes · 1 reposts · 0 replies Open on X →
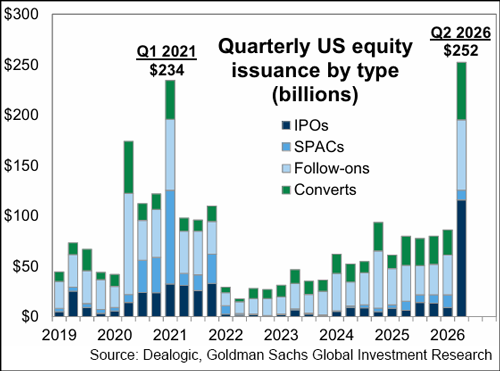
Wall Street issues new corporate shares when people crave to own them. The second quarter of 2026 set a record for stock issuance. The last big surge came in the first quarter of 2021... https://t.co/wlPzKGJZMA
5.8K views · 37 likes · 7 reposts · 5 replies Open on X →
I'll be speaking at the New Orleans Investment Conference - October 28-31. Hope to see you there: https://t.co/aDKKYhvlso 4.8K views · 21 likes · 1 reposts · 1 replies Open on X →
@RobertPrechter Bob, hope you are well you once told me ‘Look for a break of the lows’ Thank you for a life time of knowledge given back to everyone Wishing you every success Watching very closely now. Socioeconomic theory very interesting. 🙏 598 views · 7 likes · 0 reposts · 1 replies Open on X →
Market psychology is not the result of events outside the market. This psychology is impulsive, self-generating, self-sustaining and self-reversing. It operates by the same dynamics over and over again, regardless of different attendant historical or cultural specifics. Events 2.8K views · 26 likes · 1 reposts · 1 replies Open on X →
R.N. Elliott’s most important discovery is that stock market patterns develop at all degrees of trend. Larger patterns include waves that are themselves composed of smaller waves. The smaller-scale patterns combine to create any one of those patterns on a larger scale. The larger 1.8K views · 14 likes · 1 reposts · 4 replies Open on X →
"The market has a life of its own. It is mass psychology that is registering." https://t.co/r7lWen4hWG
61K views · 332 likes · 46 reposts · 33 replies Open on X →

Against accounts of the same size

11 posts from the last 90 days, next to the 10K–100K follower range. below its peers on both reach and engagement.

Median views429this account924median for 10K–100K
Reach, %2.54%this account3.62%median for 10K–100K
Engagement, %0.87%this account1.52%median for 10K–100K
MetricThis accountMedian for 10K–100KRatio
Median views per post4299240.46×
Reach (views ÷ followers)2.54%3.62%0.70×
Engagement rate0.87%1.52%0.57×

Others in this range →   Compare with another account →   How these benchmarks are built →

Growth & engagement

How the posts we collected actually performed: views and reaction rate post by post, what the audience did with them, and where the follower count goes.

Views per post

1.8K20 Mar
2.8K
598
4.8K19 Aug
5.8K26 Aug
8.7K18 Sep
35.1K21 Sep
429
115
368
7.8K23 Sep
140
98
19

Last 14 collected posts, oldest on the left. The scale is logarithmic: one post can outrun the rest a hundred times over.

Engagement rate per post

1.06%20 Mar
1.00%
1.34%
0.52%19 Aug
0.90%26 Aug
0.09%18 Sep
0.89%21 Sep
0.47%
0.87%
0.27%
1.59%23 Sep
1.43%
3.06%
0.00%

Reactions — likes, reposts, replies and quotes — divided by views. Median for 10K–100K accounts is 1.52%.

What the audience does

Likes60.3%753 in total
Reposts12.6%157 in total
Replies5.0%62 in total
Quotes2.3%29 in total
Bookmarks19.9%248 in total

Share of every reaction we collected for this account. Replies mean argument, reposts mean endorsement, bookmarks mean the post was worth keeping.

The follower curve appears once this account has two daily snapshots — we take one a day, and this one is on its first.

Similar accounts