tweetindex
EN

Daniel O'Sullivan ✓

@TRBHorseRacing · Sydney · joined 23 Sep 2009

The art & science of racehorse performance analysis. WFA Performance Ratings, times, sectionals, data insights & more. TopRate | Inside Running | Betsmart

19 945Followers
1 186Following
15 181Posts total
132.5KViews on collected posts

Latest posts

🏇Are Australian horses returning from runs overseas a risk first-up? Joliestar resumes on Saturday after her trip to the UK to run at Royal Ascot in June. 🔎 I recently did a study on this topic for @BradJGray to help with his new show, Rough Habits (check it out below). 4.5K views · 17 likes · 3 reposts · 1 replies Open on X →
🏇 The G1 Epsom Handicap weights are out, and two leading chances catch my eye. With the weights released yesterday, TopRate already has the 93 nominations with full form & ratings, adjusted to the weight each horse will carry. 🎥 In this early look, I take a look at two https:/
3:22
11.8K views · 104 likes · 6 reposts · 3 replies Open on X →
🏇 SHEZA ALIBI is already operating at a world-class level, but there are good reasons to believe we still haven’t seen her best. Her Group 1 Makybe Diva Stakes win on Saturday earned a 106.3 WFA Performance Rating ⏱️⚖️📊 The sectionals show how she asserted her dominance, but ht
25.4K views · 119 likes · 9 reposts · 5 replies Open on X →
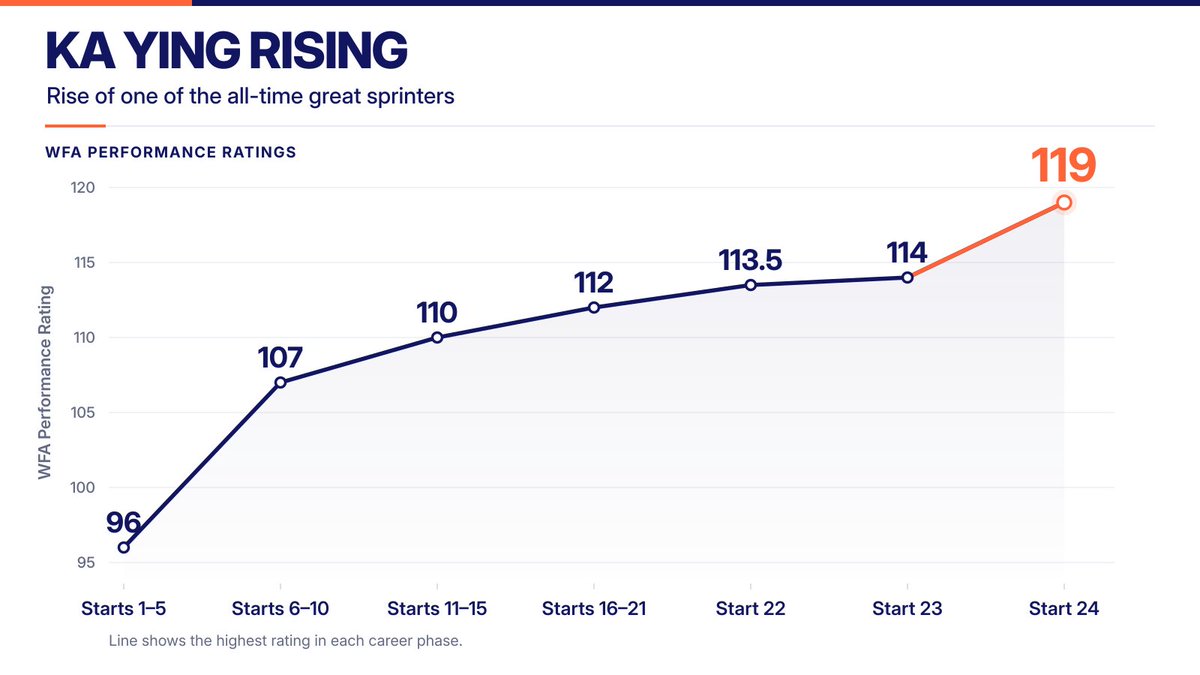
🏇 Why did I rate KA YING RISING at a new peak of 119 on Sunday? Much of the discussion about whether KYR went better than he ever has before has centred on his track record. It’s easy to get lost in arguments about speed ratings and track conditions. Instead, the clearest 9.8K views · 46 likes · 4 reposts · 9 replies Open on X →
@TRBHorseRacing What we perceive as once in a lifetime, maybe the issue. Winx, Black Caviar, Frankel, Flightline all coming within 20 years. 683 views · 7 likes · 0 reposts · 0 replies Open on X →
@TRBHorseRacing Just out of curiosity Dan what are the highest performances you’ve ever assessed on your scale and where does that 119 from KYR sit? 1.2K views · 6 likes · 1 reposts · 2 replies Open on X →
@TRBHorseRacing To be a cheeky nark for a moment (it suits me...) I would argue that having such a big change between runs 21-22-23 and the most recent run hints at runs 21-22-23 being too low. 1.9K views · 5 likes · 0 reposts · 2 replies Open on X →
🏇 KA YING RISING is every bit as good as Black Caviar in terms of the performances he’s putting on the track. His return at Sha Tin on Sunday earned an incredible 119 WFA Performance Rating ⏱️⚖️📊, lifting his peak for the third consecutive start after ratings of 113.5 and 114. h
42K views · 183 likes · 21 reposts · 14 replies Open on X →
@TRBHorseRacing ty 107 views · 0 likes · 0 reposts · 0 replies Open on X →
🆕 Introducing INSIDE RUNNING - Sharper Racing Insights. Made Simple ⏱️⚖️📊 This is my new FREE weekly publication bringing together the data, analysis & insights I share here ➕ more, all in one place (so it's not lost!) Free weekly intel, analysis & opinion drawn from my 35.1K views · 82 likes · 5 reposts · 5 replies Open on X →

Against accounts of the same size

8 posts from the last 90 days, next to the 10K–100K follower range. shown widely, but few of those viewers react.

Median views7 134this account924median for 10K–100K
Reach, %35.77%this account3.62%median for 10K–100K
Engagement, %0.57%this account1.52%median for 10K–100K
MetricThis accountMedian for 10K–100KRatio
Median views per post7 1349247.72×
Reach (views ÷ followers)35.77%3.62%9.88×
Engagement rate0.57%1.52%0.38×

Others in this range →   Compare with another account →   How these benchmarks are built →

Growth & engagement

How the posts we collected actually performed: views and reaction rate post by post, what the audience did with them, and where the follower count goes.

Views per post

35.1K21 Oct
1072 Mar
42K9 Sep
1.9K
1.2K
683
9.8K
25.4K14 Sep
11.8K15 Sep
4.5K18 Sep

Last 10 collected posts, oldest on the left. The scale is logarithmic: one post can outrun the rest a hundred times over.

Engagement rate per post

0.26%21 Oct
0.00%2 Mar
0.53%9 Sep
0.38%
0.78%
1.02%
0.61%
0.53%14 Sep
0.95%15 Sep
0.47%18 Sep

Reactions — likes, reposts, replies and quotes — divided by views. Median for 10K–100K accounts is 1.52%.

What the audience does

Likes78.5%569 in total
Reposts6.8%49 in total
Replies5.7%41 in total
Quotes1.2%9 in total
Bookmarks7.9%57 in total

Share of every reaction we collected for this account. Replies mean argument, reposts mean endorsement, bookmarks mean the post was worth keeping.

The follower curve appears once this account has two daily snapshots — we take one a day, and this one is on its first.

Similar accounts