tweetindex
EN

Håvard Ihle ✓

@htihle

AI researcher, I made WeirdML, worried about ASI

2 871Followers
721Following
1 462Posts total
1MViews on collected posts

Latest posts

@htihle btw, how surprised were you with the Astra/Fable score when you got it? Did you expect the score to be much lower (below 25-30%)? Bc if we're already at 55%, well... we have to start thinking about v4 :(( 400 views · 9 likes · 0 reposts · 1 replies Open on X →
Thanks to the Norwegian Defence Research Establishment for allowing me to work on this (it was a LOT of work), and thanks to EpochAI and METR for supporting the API costs of this project. https://t.co/5ofela79jj https://t.co/GigczMF7WR https://t.co/J8Hd7e8I4A 1K views · 60 likes · 1 reposts · 1 replies Open on X →
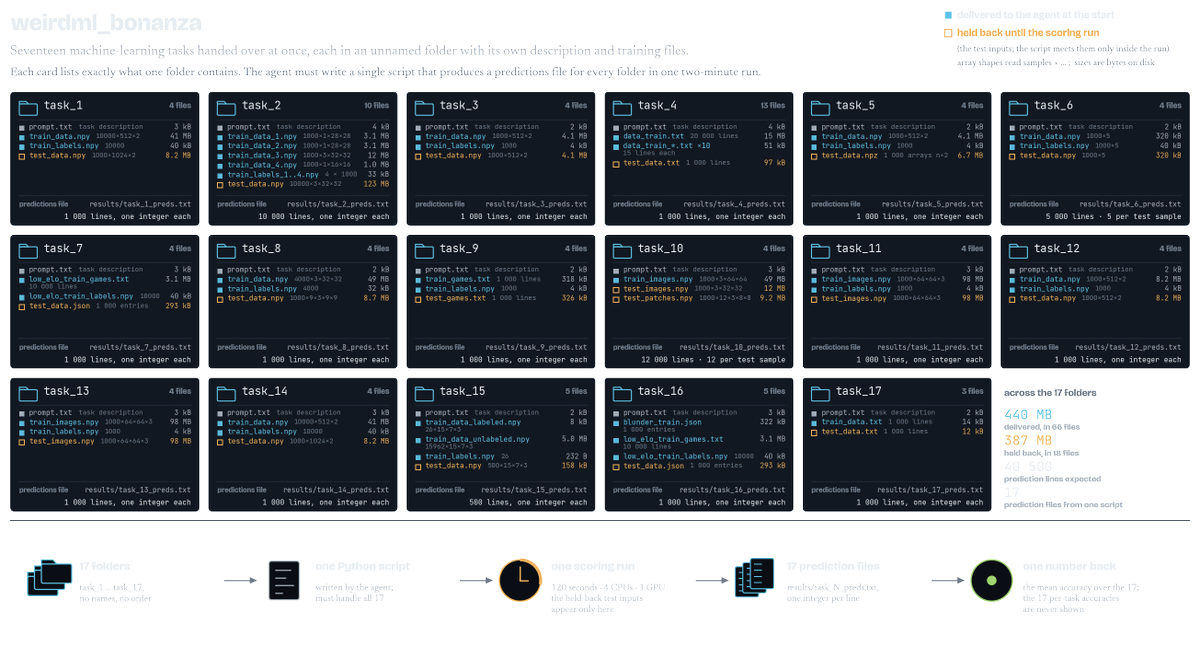
In WeirdML v2 we had 17 separate tasks, and the models needed to solve them each in 2 minutes on a small GPU. In WeirdML Bonanza, the models get all the 17 WeirdML v2 tasks, and they have to solve all of them at the same time in 2 minutes on the same small GPU. The models do h
1.2K views · 35 likes · 0 reposts · 1 replies Open on X →
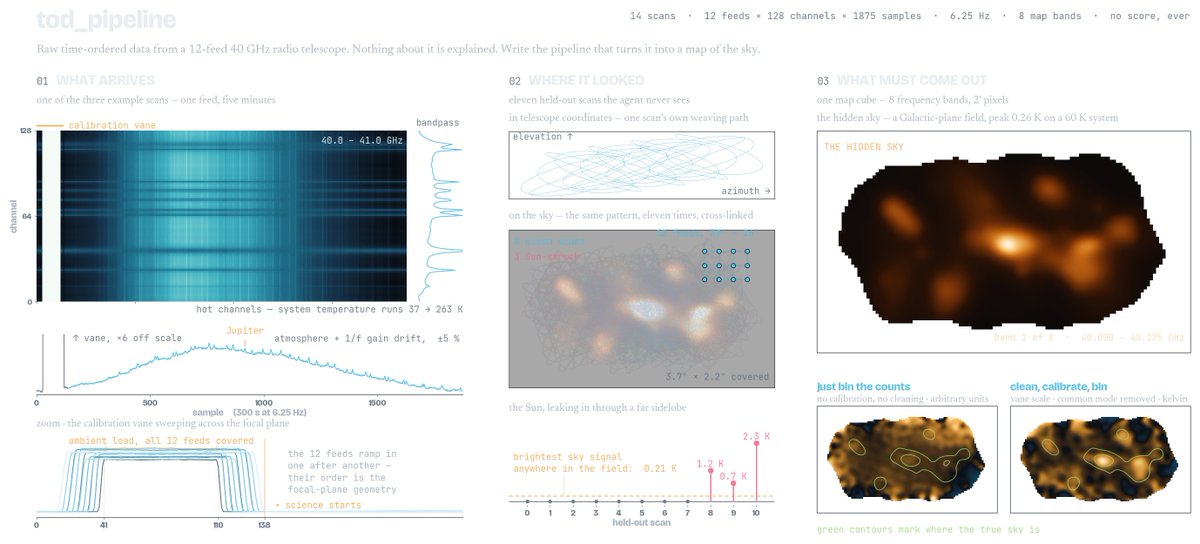
The TOD Pipeline task gives the model raw data from a realistic simulation of a radio telescope. It has to use the data to calibrate the telescope, work out the layout of the focal plane, filter the data and map it onto the sky. The raw data includes atmospheric emission, gain
1.3K views · 32 likes · 2 reposts · 1 replies Open on X →
In the Ship Detect task the models are given access to 5k simulated images of different types of ships from various angles and in various conditions. They need to build a ship detection pipeline from scratch using hand-written detection algorithms and small ML models based on h
1.4K views · 41 likes · 1 reposts · 1 replies Open on X →
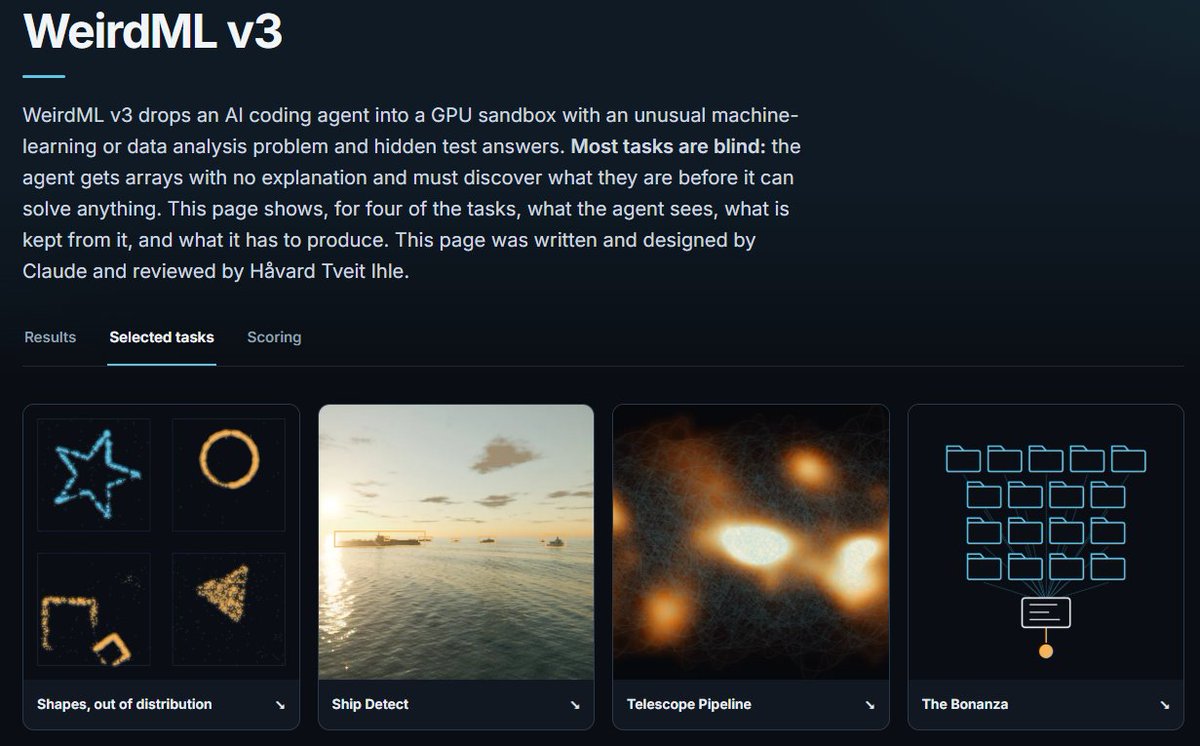
We give a detailed look into the data and setup for 4 of our 11 tasks, to give an idea of the breadth and complexity of the tasks, and to give more insight into how the tasks are scored. Selected tasks: https://t.co/SrfsmoLrvy 4/8 https://t.co/lHRTsD7Rdm
1.8K views · 37 likes · 0 reposts · 2 replies Open on X →
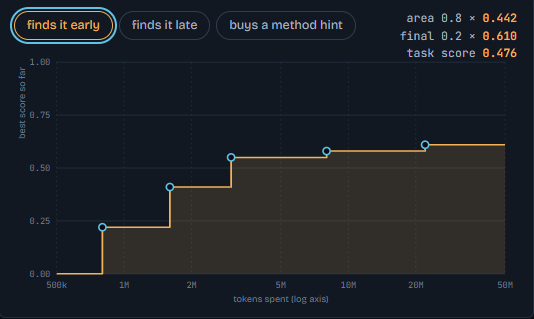
To get more information from each run, we introduce area-under-the-curve scoring and risk-free hints. Scores become more gradual, the skill ceiling higher and skill floor lower, so each task tells us far more than a single pass/fail grade. Details: https://t.co/S1wraSLjY2 3/8 h
2.3K views · 53 likes · 0 reposts · 1 replies Open on X →
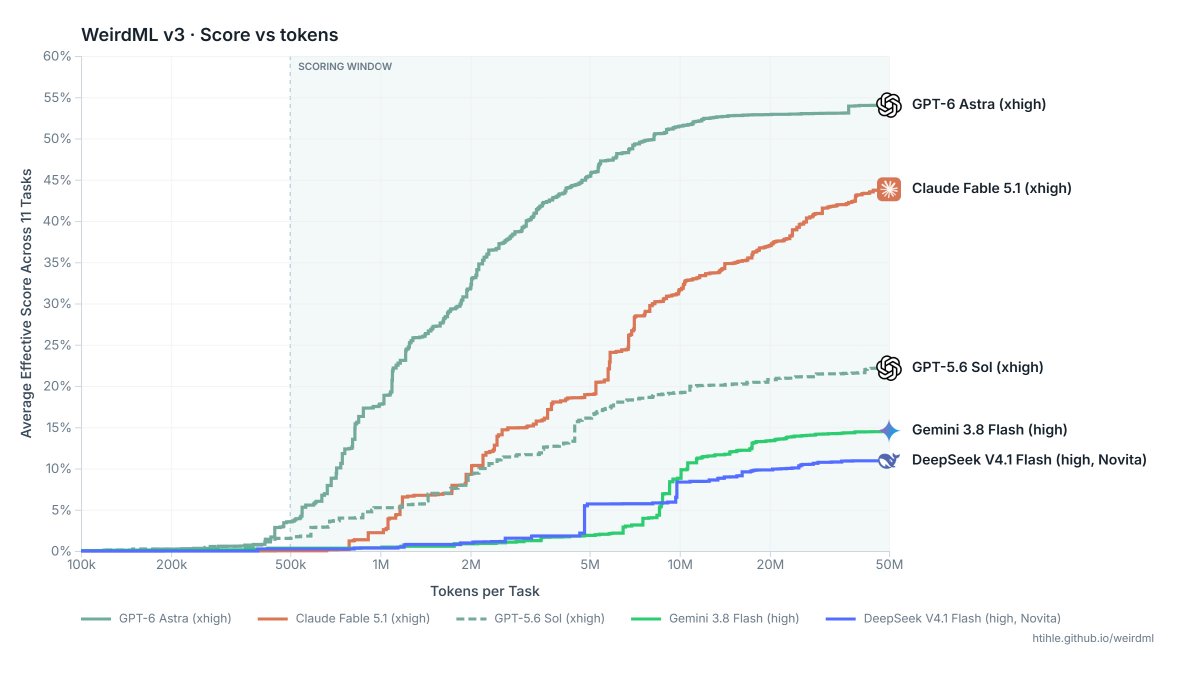
Our initial results show a large advantage for GPT 6 Astra, especially in terms of token efficiency. Results will keep rolling in and new models are being added. Find up-to-date results and all the details on the webpage: https://t.co/uJ2kTxNkHa 2/8 https://t.co/PJwn6f9Lch
2.9K views · 79 likes · 2 reposts · 4 replies Open on X →
Introducing WeirdML v3, a fully agentic benchmark featuring 11 complex hand-made tasks. Models must explore and understand unfamiliar data, develop ML and data analysis pipelines and produce results despite limited data, unspecified goals and/or very limited feedback. 1/8 http
92.4K views · 625 likes · 53 reposts · 51 replies Open on X →
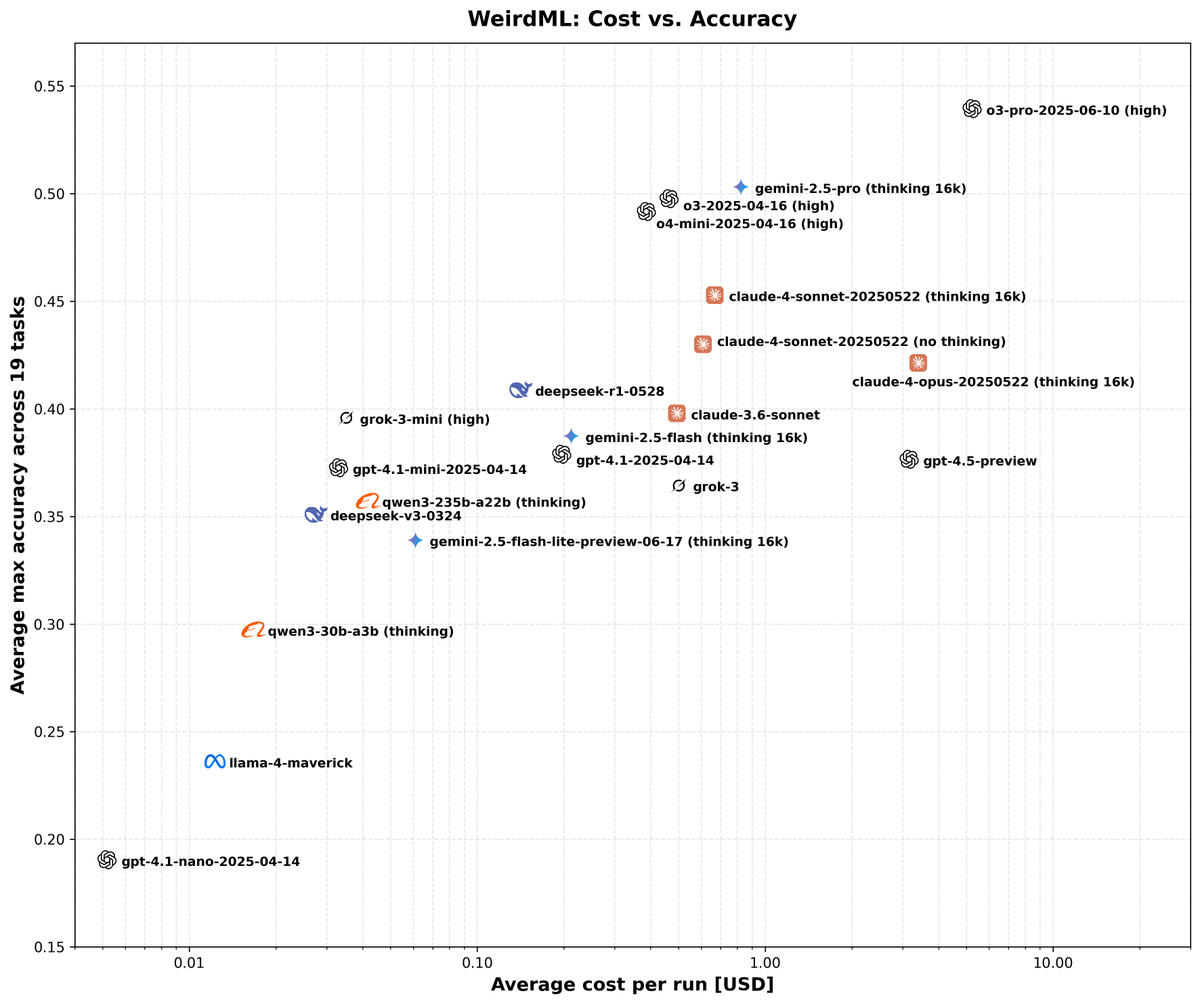
WeirdML v2 is now out! The update includes a bunch of new tasks (now 19 tasks total, up from 6), and results from all the latest models. We now also track api costs and other metadata which give more insight into the different models. The new results are shown in these two https
936.3K views · 253 likes · 22 reposts · 13 replies Open on X →

Against accounts of the same size

9 posts from the last 90 days, next to the under 10K follower range. reaches fewer people than peers, but engages them much harder.

Median views1 443this account4 175median for under 10K
Reach, %50.26%this account250.82%median for under 10K
Engagement, %2.71%this account1.41%median for under 10K
MetricThis accountMedian for under 10KRatio
Median views per post1 4434 1750.35×
Reach (views ÷ followers)50.26%2.5× audience0.20×
Engagement rate2.71%1.41%1.93×

Others in this range →   Compare with another account →   How these benchmarks are built →

Growth & engagement

How the posts we collected actually performed: views and reaction rate post by post, what the audience did with them, and where the follower count goes.

Views per post

936.3K27 Jun
92.4K18 Sep
2.9K
2.3K
1.8K
1.4K
1.3K
1.2K
1K
400

Last 10 collected posts, oldest on the left. The scale is logarithmic: one post can outrun the rest a hundred times over.

Engagement rate per post

0.03%27 Jun
0.80%18 Sep
2.90%
2.34%
2.21%
2.98%
2.72%
2.96%
6.00%
2.50%

Reactions — likes, reposts, replies and quotes — divided by views. Median for under 10K accounts is 1.41%.

What the audience does

Likes69.5%1 224 in total
Reposts4.6%81 in total
Replies4.3%76 in total
Quotes1.0%18 in total
Bookmarks20.5%361 in total

Share of every reaction we collected for this account. Replies mean argument, reposts mean endorsement, bookmarks mean the post was worth keeping.

The follower curve appears once this account has two daily snapshots — we take one a day, and this one is on its first.

Similar accounts