tweetindex
EN

Upstox ✓

@upstox · Mumbai, India · joined 22 Nov 2011

On a mission to help every Indian confidently Up their wealth! https://t.co/YkwjgiLXWo

88 583Followers
7Following
32 062Posts total
10.8KViews on collected posts

Latest posts

Discounts on pizza? Common. 🍕 Discounts on F&O stocks? Now we're listening. 👀 Amit Goel is showing traders how to identify setups that may help improve entry prices instead of blindly buying at market levels. The market won't wait. Neither should you. Link- https://t.co/QnN1iBt
1.3K views · 0 likes · 0 reposts · 0 replies Open on X →
Go ahead and try it out now: https://t.co/YyhIyEnyjf 149 views · 1 likes · 0 reposts · 0 replies Open on X →
And before you trade an idea, you can backtest it against historical data and even rewind the chart with Bar Replay. https://t.co/YOWg2BHHea
0:10
174 views · 1 likes · 0 reposts · 1 replies Open on X →
If you trade options, the Option Chain sits right there on the chart with OI, IV and Greeks, so you get everything in one view without switching screens. https://t.co/XOEs8kPbSL
93 views · 1 likes · 0 reposts · 1 replies Open on X →
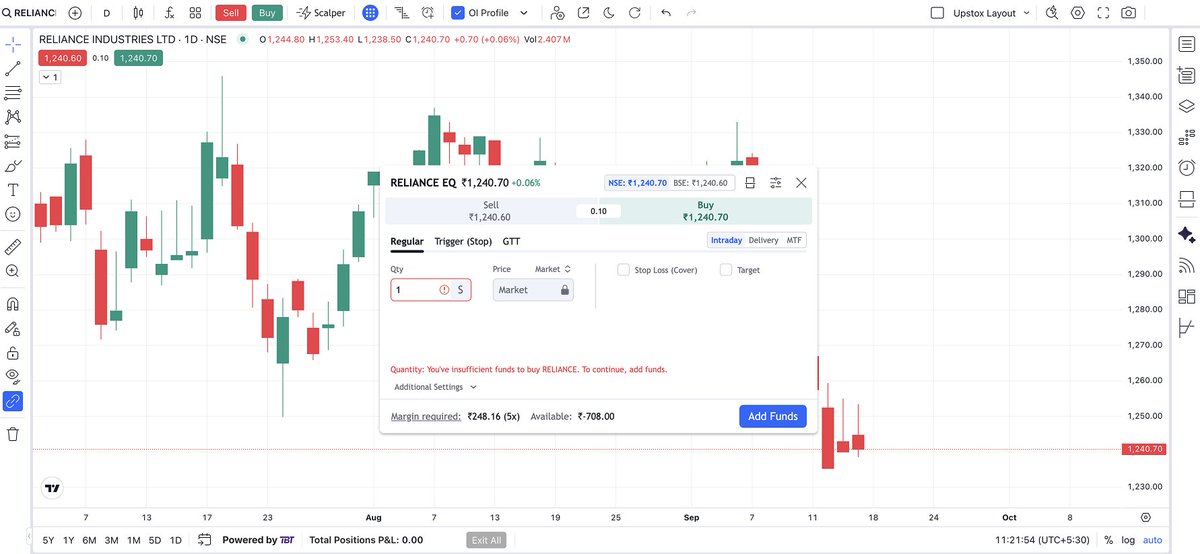
You can spot your setup and place a Buy or Sell order right from the chart, so you are not jumping to another window while the move runs away. https://t.co/V8LDahX66o
114 views · 0 likes · 0 reposts · 1 replies Open on X →
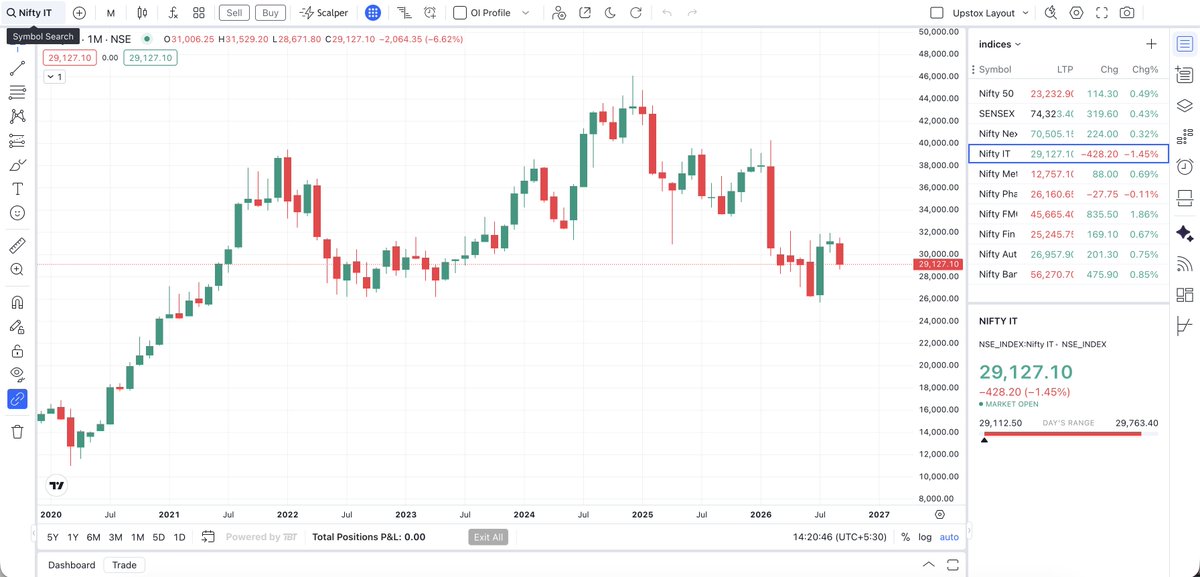
You can get the full TradingView charting experience for free on Upstox. It comes with real time data, real time price alerts, 104+ indicators, and more! The best part is, none of it needs a separate subscription. It is just part of your account, and there is plenty more you
2.6K views · 9 likes · 4 reposts · 1 replies Open on X →
Set your Price alerts for free and get real-time updates on Upstox TradingView charts. Less checking, more trading. Check it out at https://t.co/YyhIyEnyjf https://t.co/qmCPN5WfFL
1.6K views · 3 likes · 1 reposts · 1 replies Open on X →
Price, valuation, and profit history all sit on a single stock's page in Upstox US Stocks, enough to form your own view before deciding. And if you do buy, you can start with as little as $1! (7/7) https://t.co/fFmB29FTOn
0:07
118 views · 2 likes · 0 reposts · 0 replies Open on X →
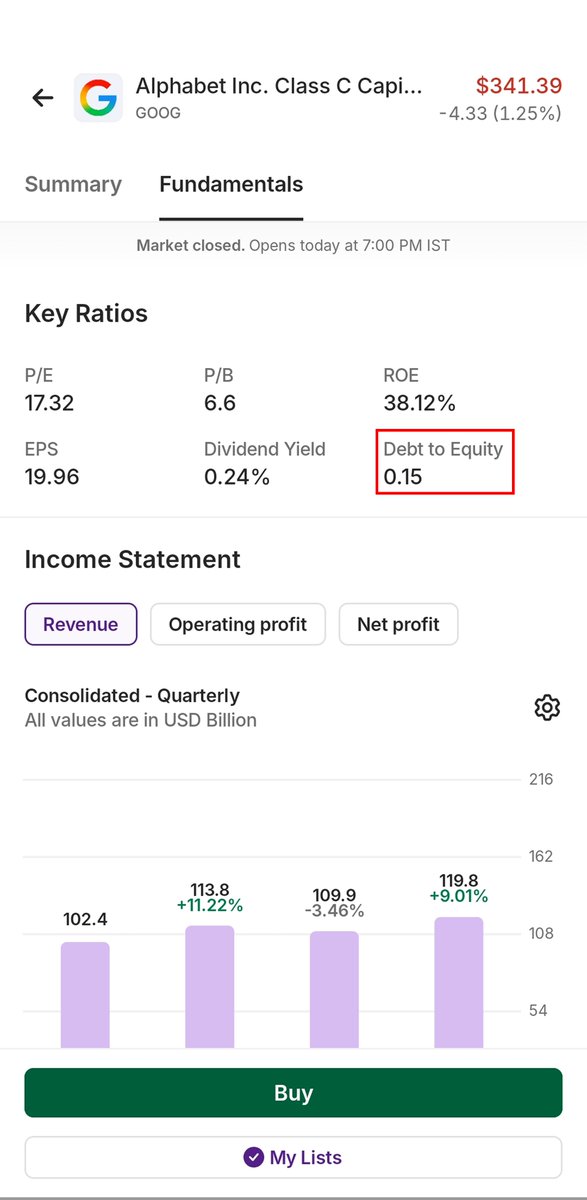
Debt-to-equity – 0.15. This means for every $1 of its own money, the company has just 15 cents of debt. A low number means the business isn't leaning on borrowing to grow. (5/7) https://t.co/hEhoZFnZBC
42 views · 2 likes · 0 reposts · 1 replies Open on X →
Then the growth trend. Yearly net profit: $60B → $73.8B → $100B → $132B — the last year up 32%. Revenue rose each year alongside it. Together, these show whether the business is growing or fading. (6/7) https://t.co/rULMtoROp2
119 views · 2 likes · 0 reposts · 1 replies Open on X →
ROE – 38%. This means for every $100 of shareholder money, the company generates $38 in profit. It shows how efficiently a business uses your money. Higher is generally better. EPS – 19.96. The profit the company earns per share. The bigger it is, the more each share earns. http
40 views · 2 likes · 0 reposts · 1 replies Open on X →
P/E – 17.32. This means the stock's price is 17.32 times its yearly profit per share. It tells you how much investors are paying for every dollar the company earns. A lower number can mean the stock is cheaper. (3/7) https://t.co/wXbIe6NeYl
66 views · 2 likes · 0 reposts · 1 replies Open on X →
Let's start with the chart. A week barely says anything, five years shows the overall direction. But the price is only half the picture. Let's look at the fundamentals underneath. (2/7) https://t.co/FvmhoniHen
0:09
135 views · 2 likes · 0 reposts · 1 replies Open on X →
Alphabet made $132 billion in profit last year, up 32%, and trades at a P/E of 17.32! Here's how to read the numbers behind a stock like this A 🧵 (1/7) https://t.co/61GPr5Jz9g
2.3K views · 3 likes · 0 reposts · 2 replies Open on X →
Check your contract note. notice that tiny exchange fee you pay on every trade? That's NSE's business, and it's 78.6% of their revenue. From Sept 17, you can own a piece of it! Its FY26 market share: → 92.9% of cash market turnover → 99.7% of equity futures → 74.7% of equity ht
2K views · 3 likes · 0 reposts · 1 replies Open on X →

Against accounts of the same size

15 posts from the last 90 days, next to the 10K–100K follower range. reaches fewer people than peers of the same size.

Median views135this account995median for 10K–100K
Reach, %0.15%this account3.92%median for 10K–100K
Engagement, %1.15%this account1.54%median for 10K–100K
MetricThis accountMedian for 10K–100KRatio
Median views per post1359950.14×
Reach (views ÷ followers)0.15%3.92%0.04×
Engagement rate1.15%1.54%0.75×

Others in this range →   Compare with another account →   How these benchmarks are built →

Growth & engagement

How the posts we collected actually performed: views and reaction rate post by post, what the audience did with them, and where the follower count goes.

Views per post

2.3K16 Sep
135
66
40
119
42
118
1.6K
2.6K17 Sep
114
93
174
149
1.3K18 Sep

Last 14 collected posts, oldest on the left. The scale is logarithmic: one post can outrun the rest a hundred times over.

Engagement rate per post

0.22%16 Sep
2.22%
4.55%
7.50%
2.52%
7.14%
1.69%
0.31%
0.55%17 Sep
0.88%
2.15%
1.15%
0.67%
0.00%18 Sep

Reactions — likes, reposts, replies and quotes — divided by views. Median for 10K–100K accounts is 1.54%.

What the audience does

Likes60.0%33 in total
Reposts9.1%5 in total
Replies23.6%13 in total
Bookmarks7.3%4 in total

Share of every reaction we collected for this account. Replies mean argument, reposts mean endorsement, bookmarks mean the post was worth keeping.

The follower curve appears once this account has two daily snapshots — we take one a day, and this one is on its first.

Similar accounts