tweetindex
EN

filbfilb

@filbfilb · joined 26 Dec 2012

83 426Followers
1 592Following
16 320Posts total
134.8KViews on collected posts

Latest posts

@filbfilb im loving it today 71 views · 2 likes · 0 reposts · 0 replies Open on X →
@filbfilb Haha 115 views · 2 likes · 0 reposts · 0 replies Open on X →
@filbfilb zcash looking great here. 434 views · 8 likes · 0 reposts · 1 replies Open on X →
Everything absolutely ripping up today Love to see it. It’s clear in my mind that if I’m long risk and I’m wrong then the outcome is probably total global doom where my portfolio is potentially completely useless. The whole situation is an asymmetric bet. 7.3K views · 73 likes · 1 reposts · 8 replies Open on X →
I can’t seem to find a way to buy TA-35 index… any suggestions? 5.3K views · 8 likes · 0 reposts · 4 replies Open on X →
I hate that feeling when when you realise that the person you are speaking to is a NPC. 7K views · 65 likes · 1 reposts · 7 replies Open on X →
I like how AI retains the human quality of constantly needing to be told to go away and do it properly after discovering that it has been a bit lazy when completing the task. 5.8K views · 27 likes · 0 reposts · 4 replies Open on X →
@filbfilb Nice analysis and approaching it from an interesting angle brother. 2.9K views · 14 likes · 0 reposts · 2 replies Open on X →
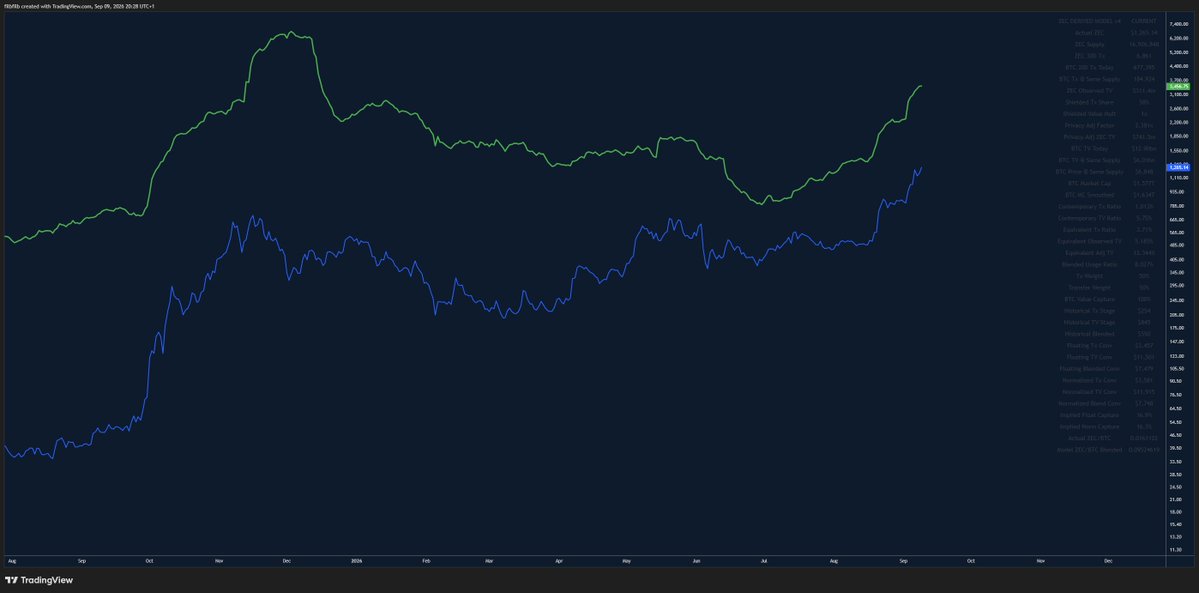
You can access the modelled prices on Tradingview. I welcome any questions, comments or improvements on the equivocal valuation models. https://t.co/TvbsKy45Di 4.8K views · 43 likes · 0 reposts · 6 replies Open on X →
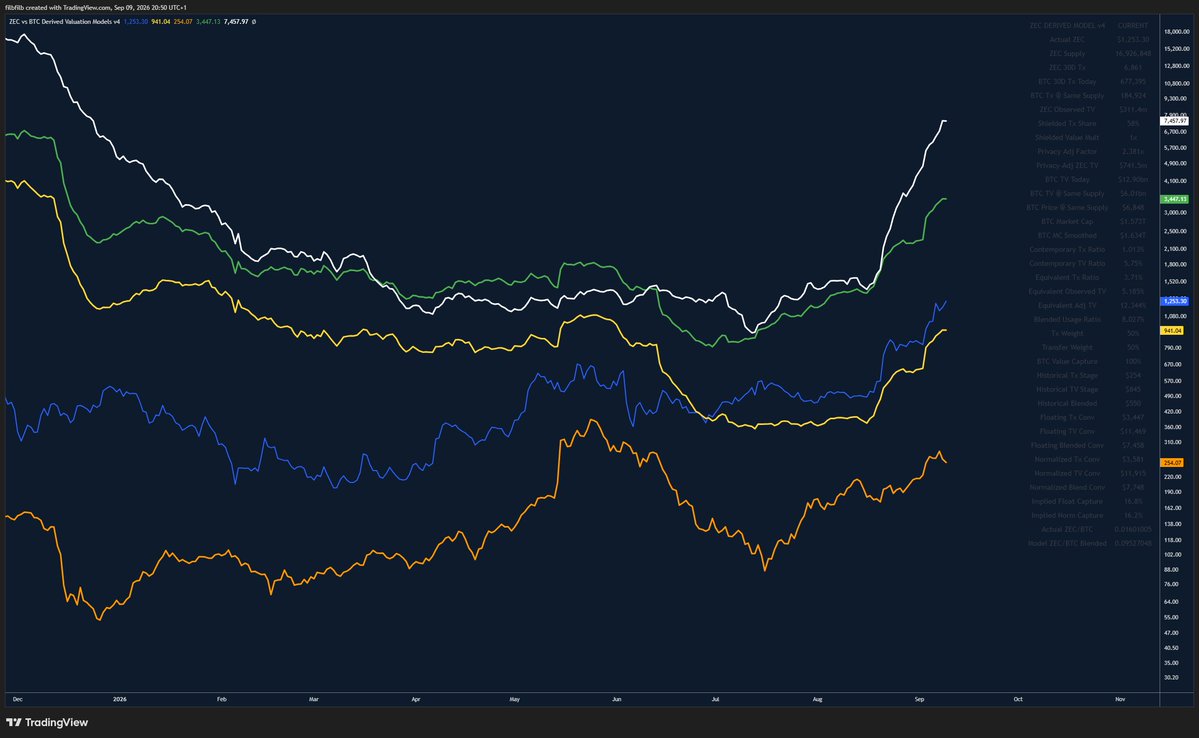
What does all of this say about ZEC at ~$1,275? I don't think ZEC looks cheap on current network activity alone. 🟠 Historical equivalent-stage transactions: ~$254 🟡 Contemporary transaction comparison: ~$944 Even after allowing for privacy-adjusted economic transfer, the http
5.2K views · 27 likes · 1 reposts · 3 replies Open on X →
10 So what did I learn? “ZEC has the same number of coins BTC once had” is not a valuation model. It's simply a useful way to identify a comparable stage in Bitcoin's monetary issuance. From there: 🟠 $254 — Historical BTC market cap × equivalent-stage transaction progress 4.2K views · 32 likes · 2 reposts · 1 replies Open on X →
8/ A significant proportion of ZEC transactions are shielded. Their transferred values are deliberately hidden. Treating that hidden economic activity as zero would systematically understate ZEC's transfer value. So rather than pretending I can observe it, I make the 4.3K views · 19 likes · 0 reposts · 1 replies Open on X →
9/ Now we can improve the Green convergence model. ⚪ Instead of measuring equivalent-stage network progress using transaction count alone, blend: 50% × 3.71% transaction share 50% × 12.34% privacy-adjusted transfer-value share = 8.03% blended equivalent-stage network https:/
4.3K views · 19 likes · 1 reposts · 2 replies Open on X →
6/ Important: $3,457 is NOT my ZEC fair-value estimate or price target. The green model asks a conditional question: If today's BTC network value represents the eventual destination, how much of that destination has ZEC earned based on equivalent-stage transaction progress? 4.7K views · 18 likes · 0 reposts · 1 replies Open on X →
7 But Orange, Yellow and Green all share one major weakness: They measure network activity using transaction count. A $10 transaction and a $10m transaction both count as one. Transaction count measures frequency. It doesn't necessarily measure economic weight. So I added a 4.5K views · 18 likes · 0 reposts · 1 replies Open on X →
5/ Now for the question I'm actually most interested in: What if today's Bitcoin network value is a potential future destination? Keep the equivalent-stage comparison from the orange model: ZEC has reached ~3.71% of BTC's transaction activity at the same issuance stage. But h
5K views · 16 likes · 0 reposts · 1 replies Open on X →
4/ Now change the question. Instead of comparing ZEC today with BTC at the matched historical issuance stage, compare both networks today. ZEC currently has ~1.01% of BTC's transaction count. Apply that to BTC's current market cap, then divide across ZEC supply: ≈ $944/ZEC ht
5.2K views · 19 likes · 0 reposts · 1 replies Open on X →
3/ First, the strict historical comparison. 🟠 Take Bitcoin's market cap when BTC had the same circulating supply ZEC has today. But don't simply give ZEC that valuation. Adjust it for relative network activity. At the matched issuance stage: ZEC 30D tx / BTC 30D tx ≈ 3.71% h
5.9K views · 28 likes · 0 reposts · 1 replies Open on X →
2/ The objective: Value ZEC through the lens of Bitcoin, while accounting for how developed the respective networks actually are. I start by matching issuance. ZEC today: ~16.93m coins. Then find the point in Bitcoin's history when ~16.93m BTC also existed. That gives us a h
6.3K views · 23 likes · 0 reposts · 1 replies Open on X →
1/10 I keep seeing zcash:native compared with early bitcoin:native because both have a 21m cap and ZEC now has roughly the number of coins Bitcoin once had. There's something interesting in that comparison. But: Same supply ≠ same network ≠ same value. So I built a model 51.4K views · 278 likes · 21 reposts · 28 replies Open on X →

Against accounts of the same size

20 posts from the last 90 days, next to the 10K–100K follower range. shown widely, but few of those viewers react.

Median views4 858this account955median for 10K–100K
Reach, %5.82%this account3.50%median for 10K–100K
Engagement, %0.54%this account1.57%median for 10K–100K
MetricThis accountMedian for 10K–100KRatio
Median views per post4 8589555.09×
Reach (views ÷ followers)5.82%3.50%1.66×
Engagement rate0.54%1.57%0.35×

Others in this range →   Compare with another account →   How these benchmarks are built →

Growth & engagement

How the posts we collected actually performed: views and reaction rate post by post, what the audience did with them, and where the follower count goes.

Views per post

4.7K9 Sep
4.3K
4.3K
4.2K
5.2K
4.8K
2.9K
5.8K11 Sep
7K12 Sep
5.3K16 Sep
7.3K17 Sep
434
115
7118 Sep

Last 14 collected posts, oldest on the left. The scale is logarithmic: one post can outrun the rest a hundred times over.

Engagement rate per post

0.41%9 Sep
0.51%
0.46%
0.84%
0.59%
1.03%
0.55%
0.54%11 Sep
1.05%12 Sep
0.23%16 Sep
1.12%17 Sep
2.07%
1.74%
2.82%18 Sep

Reactions — likes, reposts, replies and quotes — divided by views. Median for 10K–100K accounts is 1.57%.

What the audience does

Likes69.8%739 in total
Reposts2.5%27 in total
Replies6.9%73 in total
Quotes0.4%4 in total
Bookmarks20.4%216 in total

Share of every reaction we collected for this account. Replies mean argument, reposts mean endorsement, bookmarks mean the post was worth keeping.

The follower curve appears once this account has two daily snapshots — we take one a day, and this one is on its first.

Similar accounts